Web Interface (WebUI)#
You can use the WebUI to create and monitor experiment progress, track experiments, evaluate model performance, organize your experiments into projects and workspaces, start a Jupyter Notebook, and more.
Getting Started#
To access the WebUI, go to the default URL http://master-addr:8080 in your web browser, where
master-addr is the hostname or IP address of the master. If Transport Layer Security (TLS) is
enabled, use port 8443 instead.
If you have not yet established a valid Determined session, the WebUI will automatically redirect you to the sign-in page. Once you sign in, you will be redirected to the initial URL you entered.
To end the Determined session and sign out of the WebUI, select your profile name in the upper left corner and choose Sign Out.
Creating an Experiment#
If you have an existing experiment or trial, you can use the WebUI to create an experiment. You’ll need to use the CLI to create a new experiment. To learn how to create a new experiment, visit Create and Submit an Experiment.
After creating an experiment, you can use the WebUI to track its progress in real-time. The WebUI allows you to monitor metrics, analyze results, and maintain full oversight of your experiments, providing a clear and detailed view of the entire process.
Organizing Your Experiments into Projects and Workspaces#
The WebUI lets you organize your experiments into projects and workspaces. To learn more about Projects and Workspaces, visit Workspaces and Projects.
Configuring the Behavior of an Experiment#
Many experiment configuration settings can be performed via the WebUI. To learn more about configuring an experiment via a YAML file, visit Experiment Configuration Reference.
Evaluating Model Performance and Experiment Runs#
You can access training and validation performance information via the WebUI to evaluate your model. To see model evaluation in action, follow the steps described in the PyTorch MNIST Tutorial.
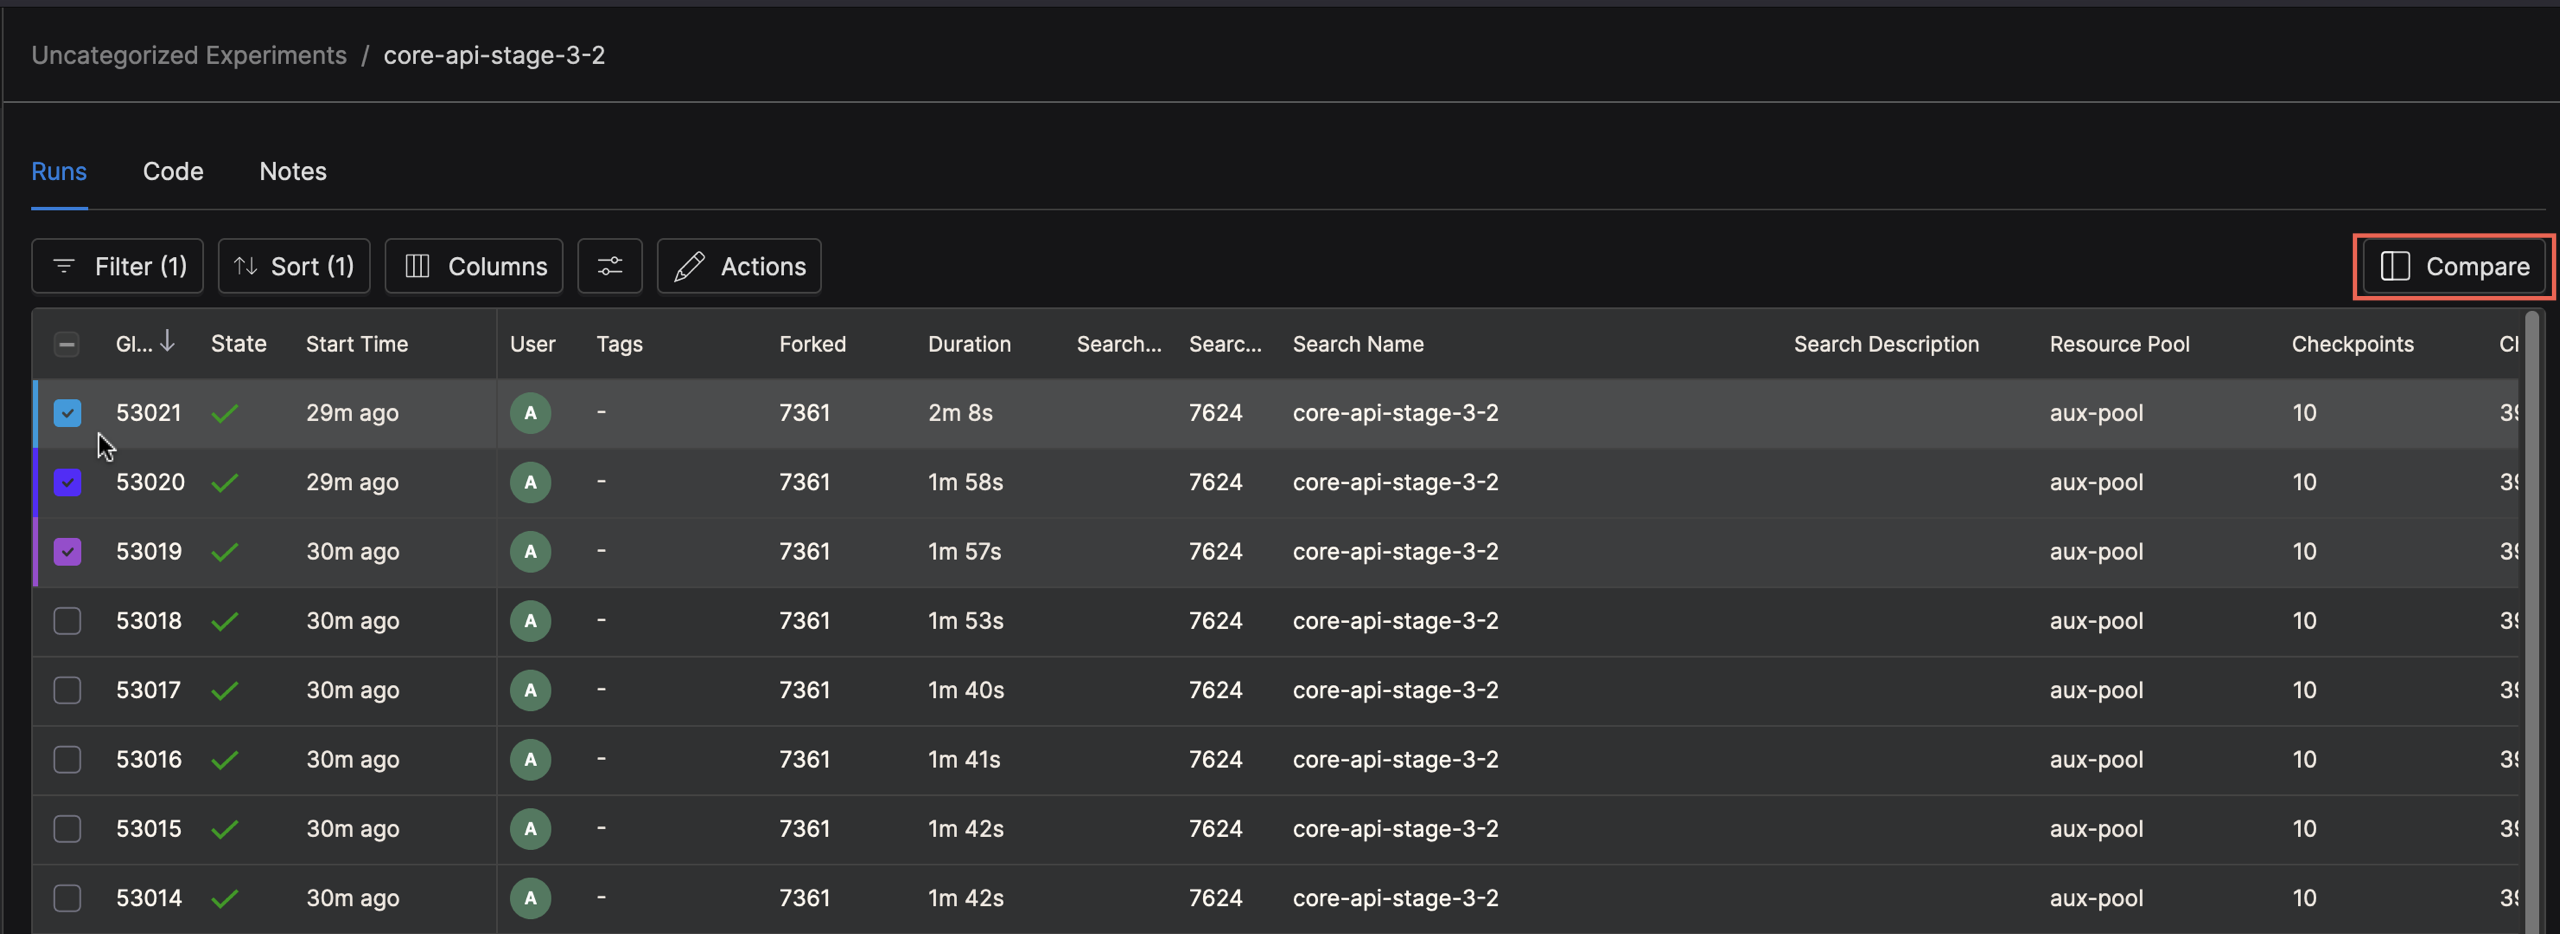
You can also compare single trials with various datasets, parameters, and settings so that you can choose the best model. This simplified flat trials view lets you perform a quick metric evaluation by selecting two or more runs to compare. This feature can be toggled on or off in user settings.
To start, select two or more runs and then select Compare:
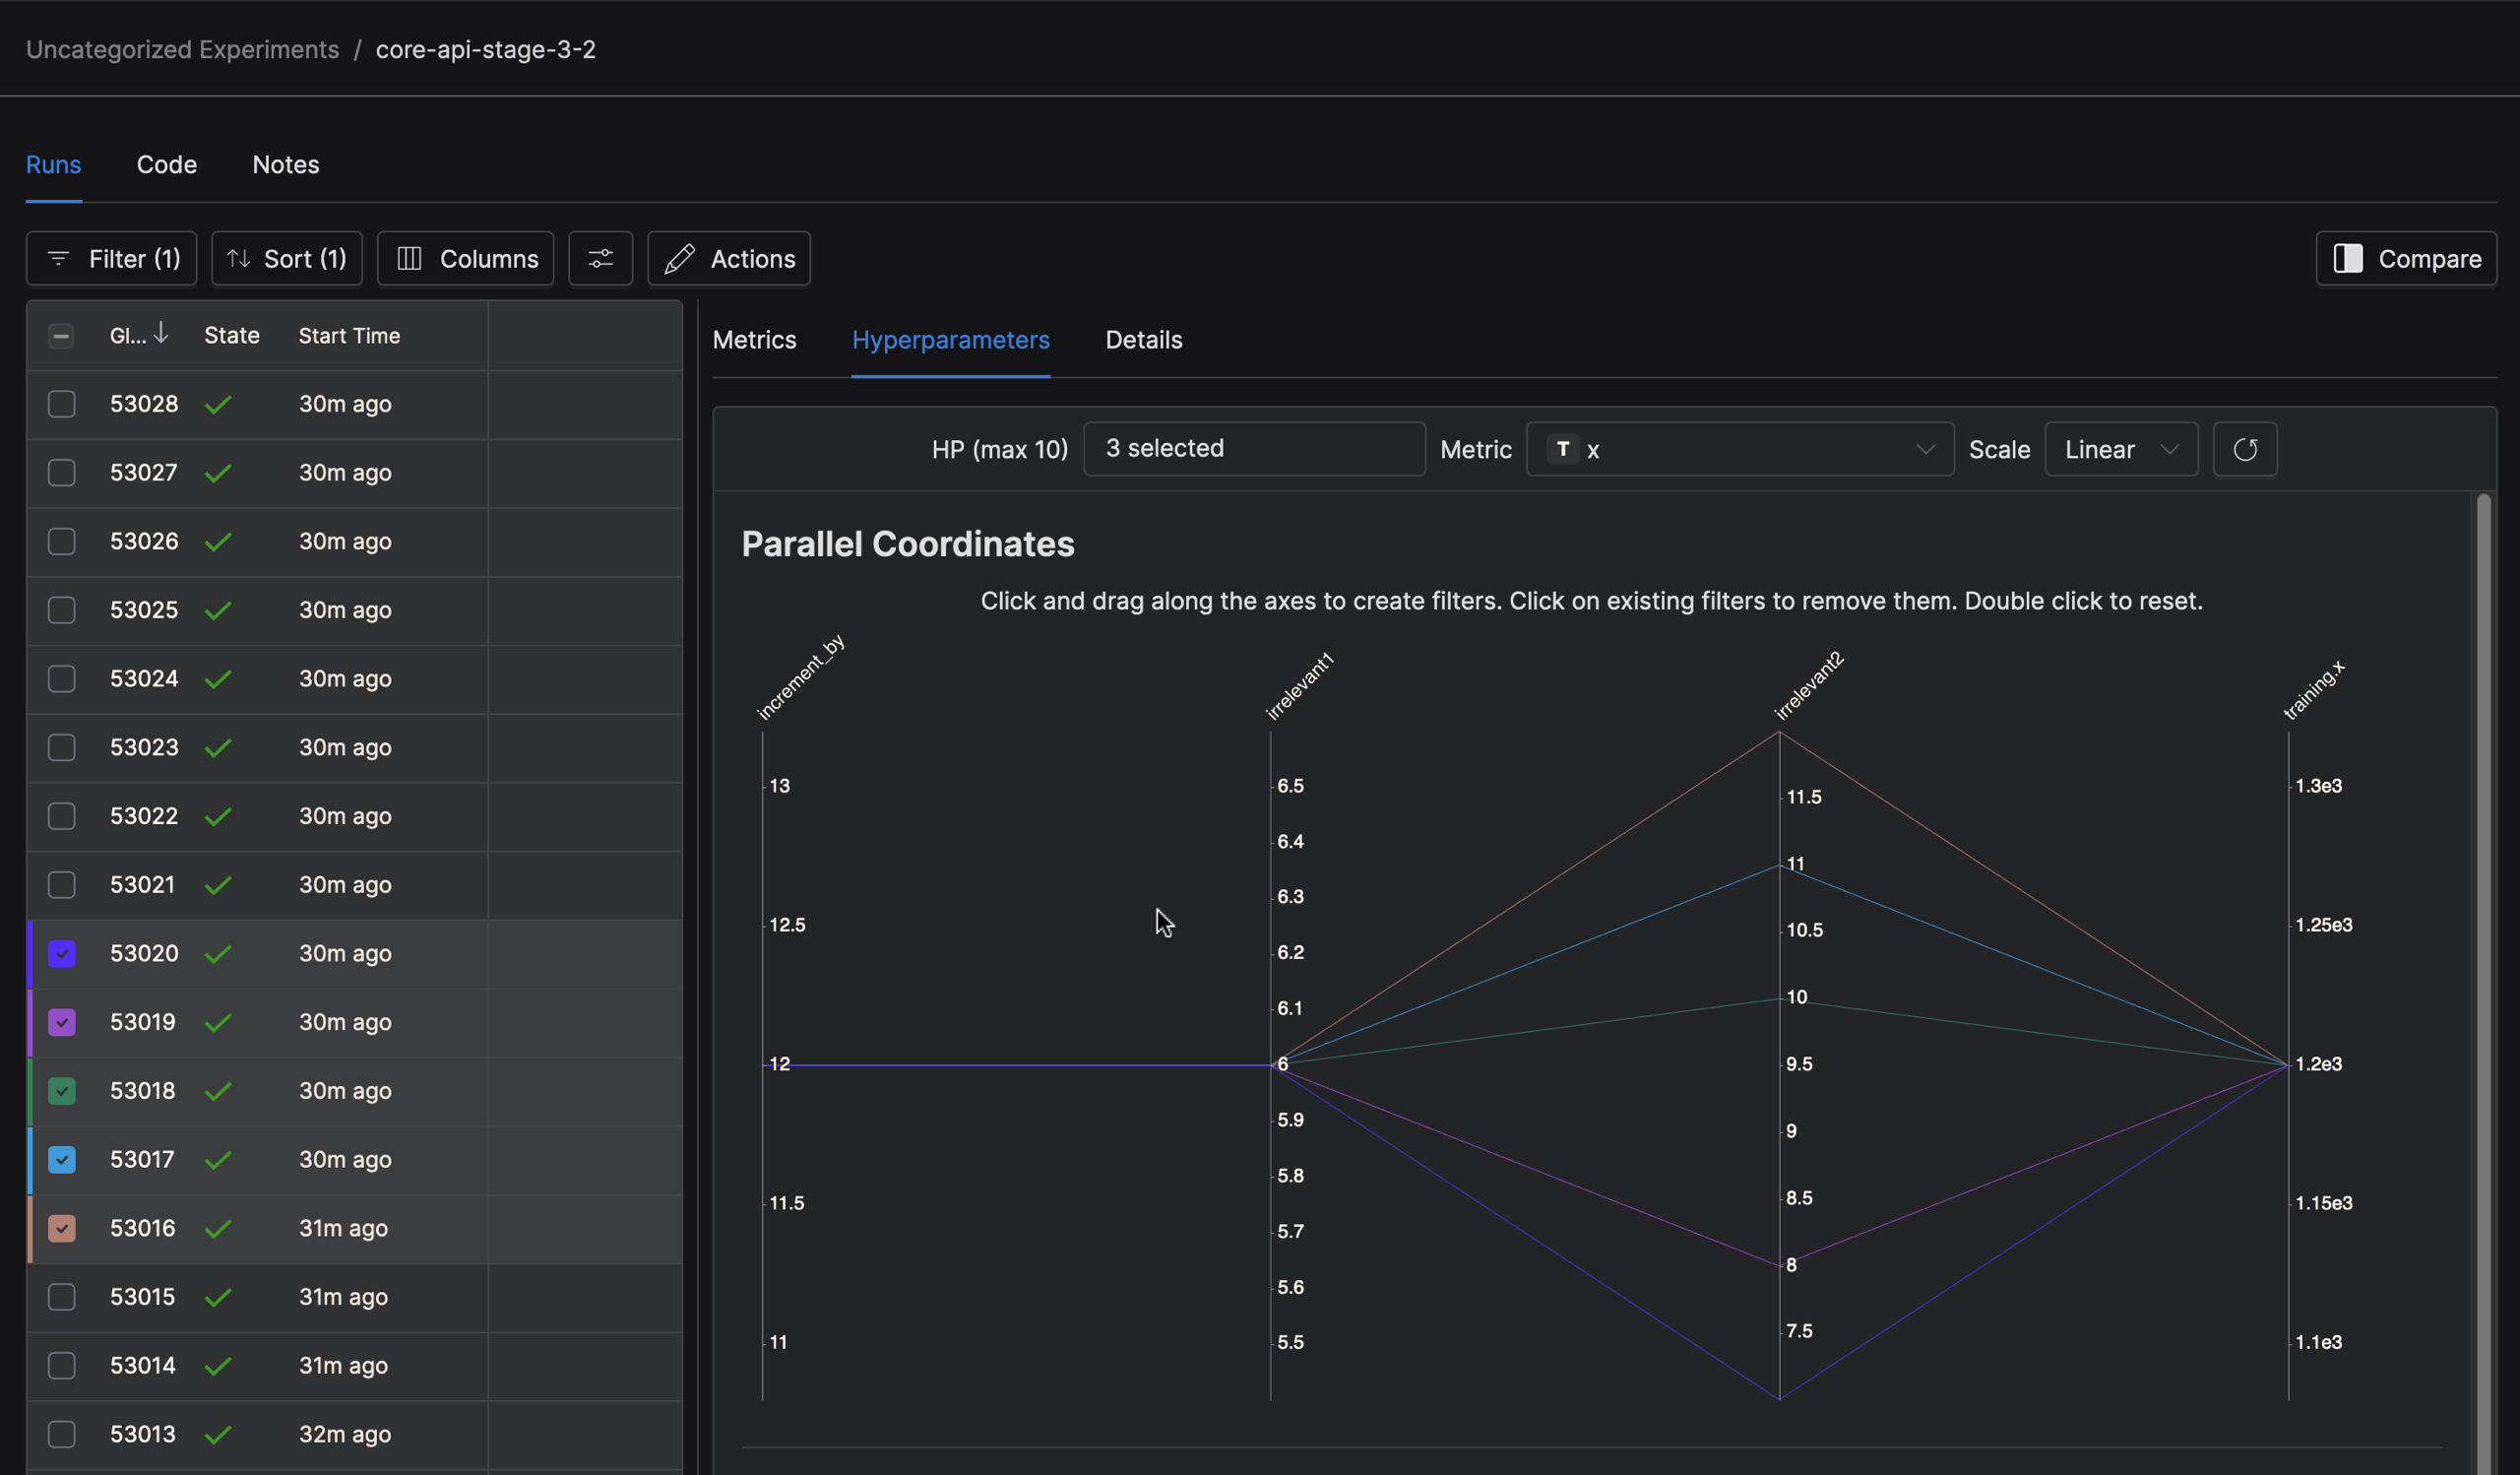
In the compare view, choose a tab for comparing metrics, hyperparameters, and other details of the runs you selected.
Adding Models to the Model Registry#
You can use the WebUI to create and edit models and add models to the model registry. You can also use the WebUI to edit model metadata. To find out more, visit Organize Models in the Model Registry.
Viewing Historical Cluster Usage Data#
You can use the WebUI to view Historical Cluster Usage Data.
Viewing Cluster Topology#
To view a resource pool’s node and GPU distribution, and find out how many GPUs are currently in use, follow these steps:
Navigate to Resource Pools.
From the left navigation pane, select Cluster to view Resource Pools.
Select a Resource Pool.
In the resource pool details page, you will find a Topology section visible if agents or nodes are provisioned. If no agents or nodes are provisioned, the Topology section will not be visible.
This view displays a visual representation of each node, including its unique identifier, and the number of available slots on each node.
View Active and Used Slots.
In the topology visualization, all active or used slots will be highlighted in blue, making it easy to distinguish between available and occupied resources.
Managing User Accounts and Groups#
The admin user manages user authentication including creating and managing users. To learn more,
visit User Accounts.
With the Determined Enterprise Edition, you can also create and manage user groups. To learn more, visit RBAC.
Managing User Settings#
User settings allow you to manage profile settings, preferences, and shortcuts. You can also toggle experimental features on or off and access advanced features.
To view user settings:
Select your profile name in the upper left corner and choose Settings.
To change user settings:
Select the edit icon.
Make changes to the setting.
Confirm the changes by selecting the checkmark.
To revert to default settings:
Navigate to the Advanced section of the user settings.
Select I know what I’m doing.
Select Reset to Default.
Confirm you want to reset all user settings to their default values.
Selecting a Table Density (Row Height)#
In the Preferences section of your user settings, you can set the table density so that the rows are shorter or taller.
Toggling Experimental (Pre-Release) Features On or Off#
In the Experimental section of your user settings, you can turn experimental features on or off. However, if you don’t know what the feature is referring to or the possible impact, you likely should not turn it on.
Caution
Experimental features are pre-release features. They can be changed or removed at any time.
Configuring Telemetry#
To find what kind of anonymous information the WebUI collects, visit Common Configuration Options.
Viewing and Managing the Job Queue#
To find out how to view and modify the Job Queue in the WebUI, start with Managing the Job Queue.
Starting a Jupyter Notebook#
You can start Jupyter Notebooks from the WebUI.
Launching TensorBoard#
You can launch TensorBoard from the WebUI. To learn how, visit Using TensorBoard.
Viewing Log Search Results#
To perform a log search:
Navigate to your run in the WebUI.
In the Logs tab, start typing in the search box to open the search pane.
To use regex search, click the “Regex” checkbox in the search pane.
Click on a search result to view it in context, with logs before and after visible.
Scroll up and down to fetch new logs.
Note: Search results are not auto-updating. You may need to refresh to see new logs.