Prometheus & Grafana#
Supported Versions |
|---|
Grafana 8.3.0+ |
Prometheus 2.14.0 |
Determined 0.17.6+ |
Discover how to enable a Grafana dashboard to monitor Determined hardware and system metrics. Determined provides a Prometheus endpoint that contains mappings between internal task, GPU, and container definitions, which are used by Prometheus to collect relevant metrics on a cluster running Determined. The endpoint is enabled by default but can be disabled in the master configuration file.
Visit Kubernetes Observability for instructions on enabling observability in Kubernetes environments.
Reference#
Constraints#
The Determined Prometheus endpoint is configured to work with cAdvisor for CPU metrics and dcgm-exporter (DCGM) for GPU metrics. The default ports for cAdvisor, 8080, and dcgm-exporter, 9400, are hardcoded into the Prometheus endpoint. If an agent is running on the same machine as the master, the master must be running on a port other than 8080 for cAdvisor metrics to be scraped. Although other monitoring tools can be used with the setup, this guide describes only cAdvisor and DCGM tool configuration. Prometheus queries on metrics collected by other tools can differ, depending on the format and organization of the returned metrics.
Prerequisites#
A Grafana installation for dashboard monitoring.
An on-cluster Prometheus instance for time-series data collection.
Configure Determined#
Install and run Determined on a cluster. When launching the master instance, the Prometheus
endpoints are enabled by default in versions 0.32.0 and later. To manually enable the Prometheus
endpoints, add a flag to the master.yaml configuration file:
observability:
    enable_prometheus: true
This enables the following two Prometheus API endpoints on the instance.
{$DET_MASTER_ADDR}/prom/det-state-metrics:The
det-state-metricsendpoint includes various machine-level label mappings to internal Determined entities, such as GPU UUIDs and container IDs to task, allocation, and experiment labels, which are used by PromQL to join vectors.{$DET_MASTER_ADDR}/prom/det-http-sd-config:The
det-http-sd-configendpoint contains address and resource pool information for currently active agents. These are used by Prometheus as targets for scraping. This endpoint is configured to support running default cAdvisor, port 8080, and DCGM, port 9400, monitoring. Other tools exposing Prometheus metrics can be used instead of cAdvisor and DCGM if they are running on these ports.
Configure cAdvisor and dcgm-exporter#
The cAdvisor and dcgm-exporter monitoring tools must be running on the cluster agents to be monitored. These can be installed manually or run as individual Docker containers.
To configure dynamic agents to start up with cAdvisor and dcgm-exporter, add the following startup
script to the master.yaml file:
- pool_name: compute-pool
    provider:
      startup_script: |
        # Run dcgm-exporter on 9400
        docker run -d --gpus all --rm -p 9400:9400 nvcr.io/nvidia/k8s/dcgm-exporter:2.3.2-2.6.3-ubuntu20.04

        # Run cAdvisor on 8080
        VERSION=v0.36.0
        docker run \
          --volume=/:/rootfs:ro \
          --volume=/var/run:/var/run:ro \
          --volume=/sys:/sys:ro \
          --volume=/var/lib/docker/:/var/lib/docker:ro \
          --volume=/dev/disk/:/dev/disk:ro \
          --publish=8080:8080 \
          --detach=true \
          --name=cadvisor \
          --privileged \
          --device=/dev/kmsg \
          gcr.io/cadvisor/cadvisor:$VERSION
This example startup script includes the default setup docker commands provided by dcgm-exporter and cAdvisor.
Configure Prometheus#
Install Prometheus on any node in the monitored cluster.
Launch Prometheus with the provided prometheus.yml configuration file.
To replace the placeholder master address, you’ll need to edit the Prometheus configuration file.
The
metric_relabel_configsparameter edits certain label names in jobs for joining in PromQL.The
scrape_intervalparameter values can be modified to optimize for resolution/size/time.The
$PATH_TO_TOKENspecifies a path to an authorization token for the Determined master. This can be kept in a local file by running thetoken-refresh.shscript in the same directory with a CRON job (set to run daily).
Configure Grafana#
A Grafana instance can be installed on any machine that adds the above Prometheus address as a data source. After the Grafana server is running and the Web UI is accessible, follow these steps:
Add a Prometheus data source in Grafana -> Configuration -> Data Sources -> Add data source.
Configure the Prometheus data source set up in the previous section by setting the URL to your running Prometheus server address. By default, this is the machine address on port 9090.
After the Prometheus data source connects, import the Determined Hardware Metrics dashboard JSON file in Grafana -> Create -> Import -> Import using panel JSON.
Example#
Following the above configuration steps and after submitting experiments on the cluster, you should see populated panels in the imported Grafana dashboard: Grafana -> Dashboards.
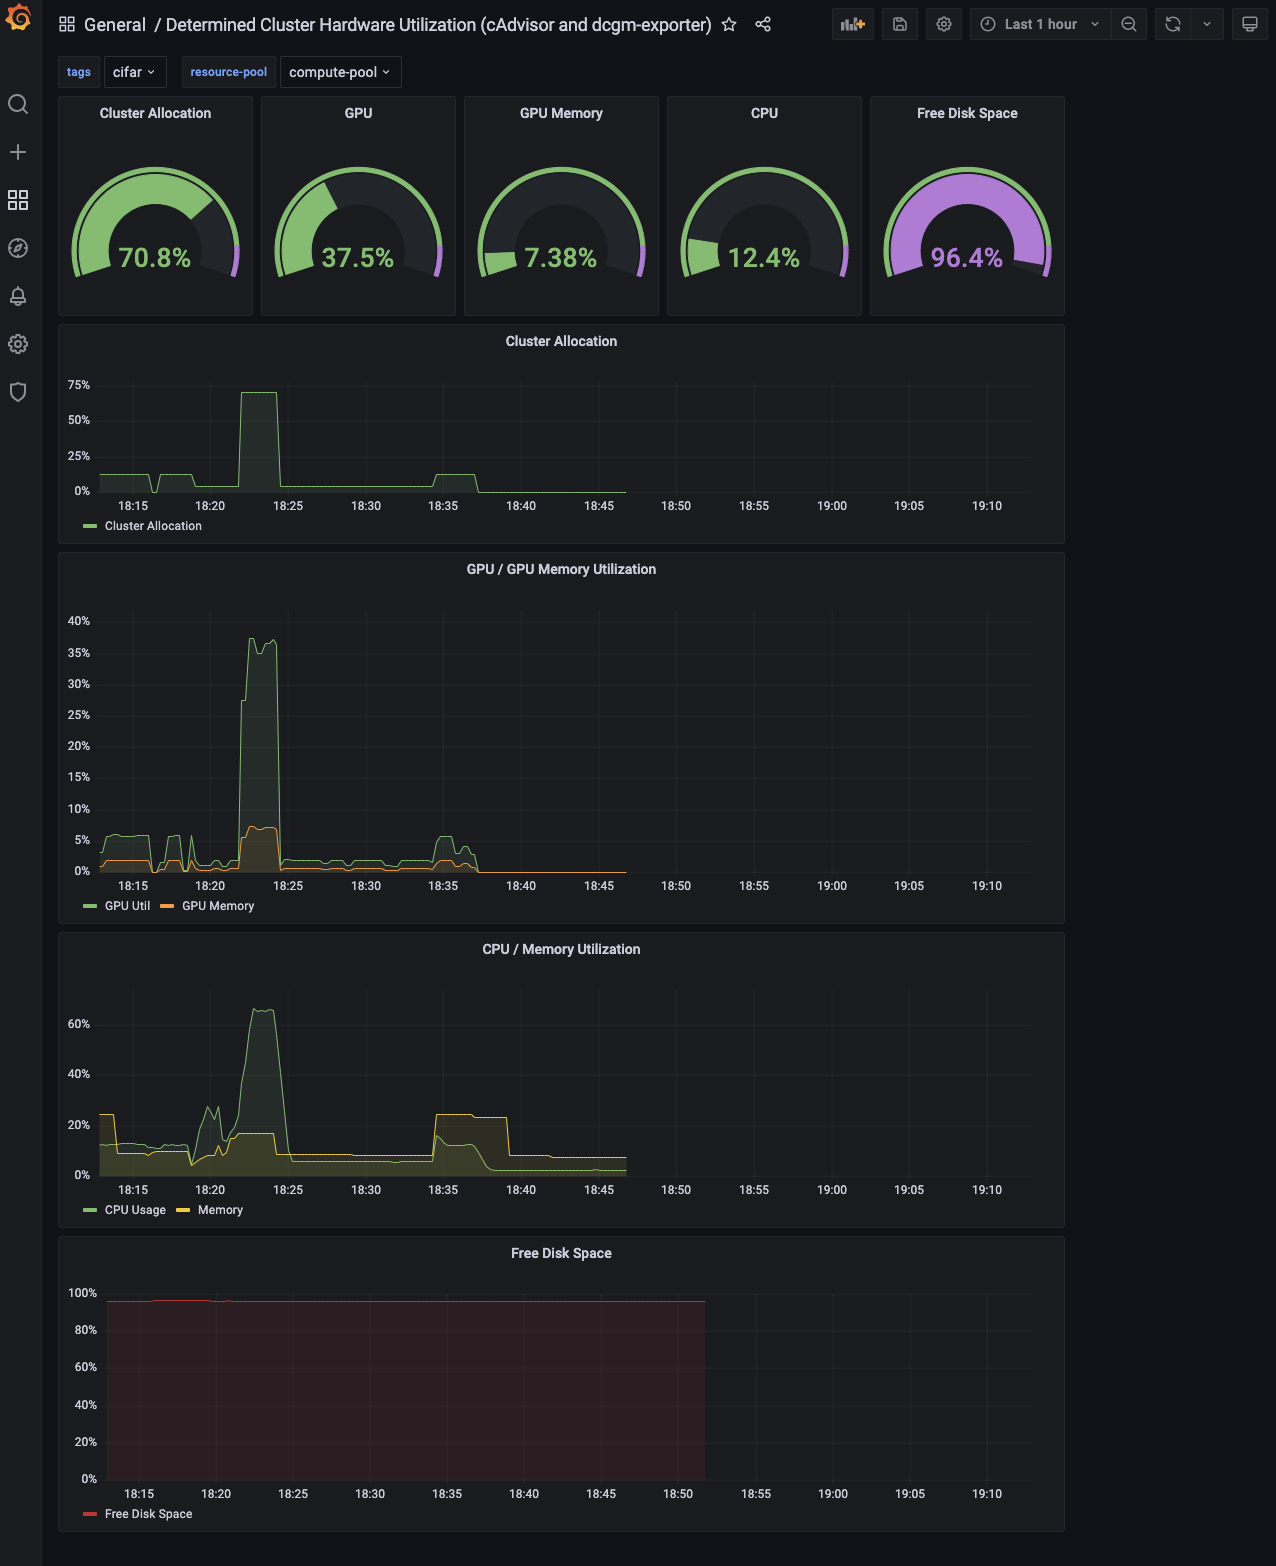
Each panel in the dashboard is powered by one or more Prometheus queries and tracks a specific
metric on the cluster as a percentage of total capacity. Results can be further filtered using
tags and resource pool and time range in Grafana.
Alerts#
The det-master-api-server provides a metric, determined_healthy, that can be used to set up
alerts. This metric will return 1 when Determined can access its major dependencies and 0
when it cannot. On Kubernetes, inability to access the Kubernetes API server will cause this metric
to return 0. On Slurm, failure to access the launcher will also cause this metric to return
0. If the database is down, it is possible Prometheus will be unable to scrape this metric.
To create an alert in Grafana, navigate to the Alert Rules page and use the Prometheus data source configured earlier. You can use the following query to set up the alert.
1 - determined_healthy{job="det-master-api-server"}
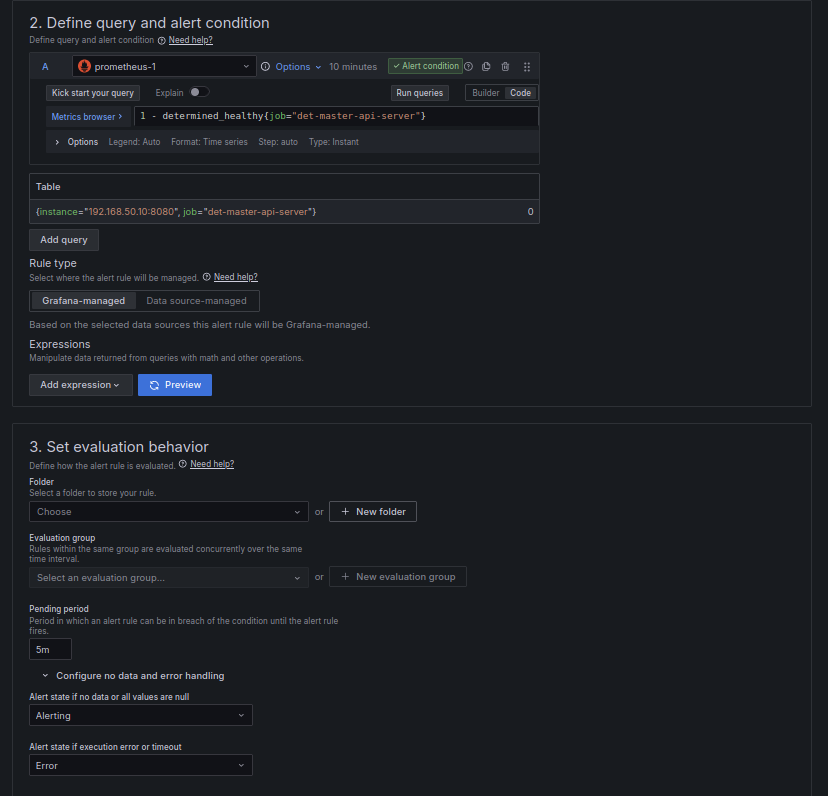
Since Prometheus may be unable to scrape Determined under certain circumstances, it is recommended
to set Alert state if no data or all values are null to Alerting.
For more information on using Grafana alerts, visit the Grafana documentation.