Core API User Guide#
Learn how to adapt model training code to use the Core API.
Note
You can also visit the Get Started with Core API that shows you how to get started with the Core API by performing a simple exercise–incrementing an integer.
Visit the API reference |
|---|
In this user guide, we’ll show you how to adapt model training code to use the Core API. As an example, we’ll be working with the PyTorch MNIST model.
Objectives#
These step-by-step instructions walk you through modifying a script for the purpose of performing the following functions:
Report metrics
Report checkpoints
Perform a hyperparameter search
Perform distributed training
After completing the steps in this user guide, you will be able to:
Understand the minimum requirements for running an experiment
Modify a script and an experiment configuration file
Understand how to convert model code
Use the Core API to train a model
Prerequisites#
Required
A Determined cluster
Recommended
Step 1: Get the Tutorial Files & Run the Experiment#
To run an experiment, you need, at minimum, a script and an experiment configuration (YAML) file.
Create a new directory.
Access the tutorial files via the core_api_pytorch_mnist.tgz download link or directly from the Github repository.
These scripts have already been modified to fit the steps outlined in this tutorial.
In this initial step, we’ll run our experiment using the model_def.py script and its
accompanying const.yaml experiment configuration file.
CD into the directory and run this command:
det e create const.yaml . -f
Note
det e create const.yaml . -f instructs Determined to follow the logs of the first trial that
is created as part of the experiment. The command will stay active and display the live output
from the logs of the first trial as it progresses.
Open the Determined WebUI by navigating to the master URL. One way to do this is to navigate to
http://localhost:8080/, accept the default username of determined, and click Sign In.
After signing in, create a strong password.
Note
This tutorial provides instructions for running a local distributed training job. Your setup may be different. For example, for instructions on how to run a remote distributed training job, visit the Quickstart for Model Developers.
In the WebUI, select your experiment. You’ll notice the tabs do not yet contain any information. In the next section, we’ll report training and validation metrics.
Step 2: Report Metrics#
To report training and validation metrics to the Determined master, we’ll add a few lines of code to
our script. More specifically, we’ll create a Context object to allow
interaction with the master. Then, we’ll pass the core_context as an argument into main(),
train(), and test() and modify the function headers accordingly.
To run our experiment, we’ll use the model_def_metrics.py script and its accompanying
metrics.yaml experiment configuration file.
Note
For this tutorial, we’ve already created the script for you. Take a moment to review the changes we’ve made to the provided script so that you’ll know how to modify your own script.
To run the experiment, you can either use the provided scripts, which have already been modified, or you can build your own file by making changes to “model_def.py”.
Begin by importing Determined:
import determined as det
Step 2.1: Modify the Main Loop#
We’ll need a Context object for interacting with the master. To accomplish
this, we’ll modify the __main__ loop to include core_context:
Note
Refer to the if __name__ == "__main__": block in model_def_metrics.py
if __name__ == "__main__":
    # NEW: Establish new determined.core.Context and pass to main
    # function.
    with det.core.init() as core_context:
        main(core_context=core_context)
Step 2.2: Modify the Train Method#
Use core_context.train to report training and validation metrics.
Begin by importing the
determinedmodule:
# NEW: Report training metrics to Determined master via core_context.
# Index by batches_completed + epoch_idx * len(train_loader)
# to continuously plot loss on one graph for consecutive epochs.
core_context.train.report_training_metrics(
    steps_completed=batches_completed + epoch_idx * len(train_loader),
    metrics={"train_loss": loss.item()},
)
and core_context.train.report_validation_metrics():
# NEW: Report validation metrics to Determined master via core_context.
core_context.train.report_validation_metrics(
    steps_completed=steps_completed,
    metrics={"test_loss": test_loss},
)
Step 2.3: Modify the Test Method#
Modify the test() function header to include args and other elements you’ll need during the
evaluation loop. The args variable lets you pass configuration settings such as batch size and
learning rate. In addition, pass the newly created core_context into both train() and
test(). Passing core_context enables reporting of metrics to the Determined master.
# NEW: Pass core_context into train() and test().
train(args, model, device, train_loader, optimizer, epoch_idx, core_context)

# Docs snippet start: calculate steps completed
# NEW: Calculate steps_completed for plotting test metrics.
epochs_completed = epoch_idx + 1
steps_completed = epochs_completed * len(train_loader)
# Docs snippet end: calculate steps completed

# NEW: Pass args, test_loader, epoch, and steps_completed into test().
test(
    args,
    model,
    device,
    test_loader,
    epoch_idx,
    core_context,
    steps_completed=steps_completed,
)
scheduler.step()
Create a steps_completed variable to plot metrics on a graph in the WebUI:
# NEW: Calculate steps_completed for plotting test metrics.
epochs_completed = epoch_idx + 1
steps_completed = epochs_completed * len(train_loader)
Step 2.4: Run the Experiment#
Run the following command to run the experiment:
det e create metrics.yaml .
Open the Determined WebUI again, select your experiment, and go to the experiment’s Overview tab. The WebUI now displays metrics.
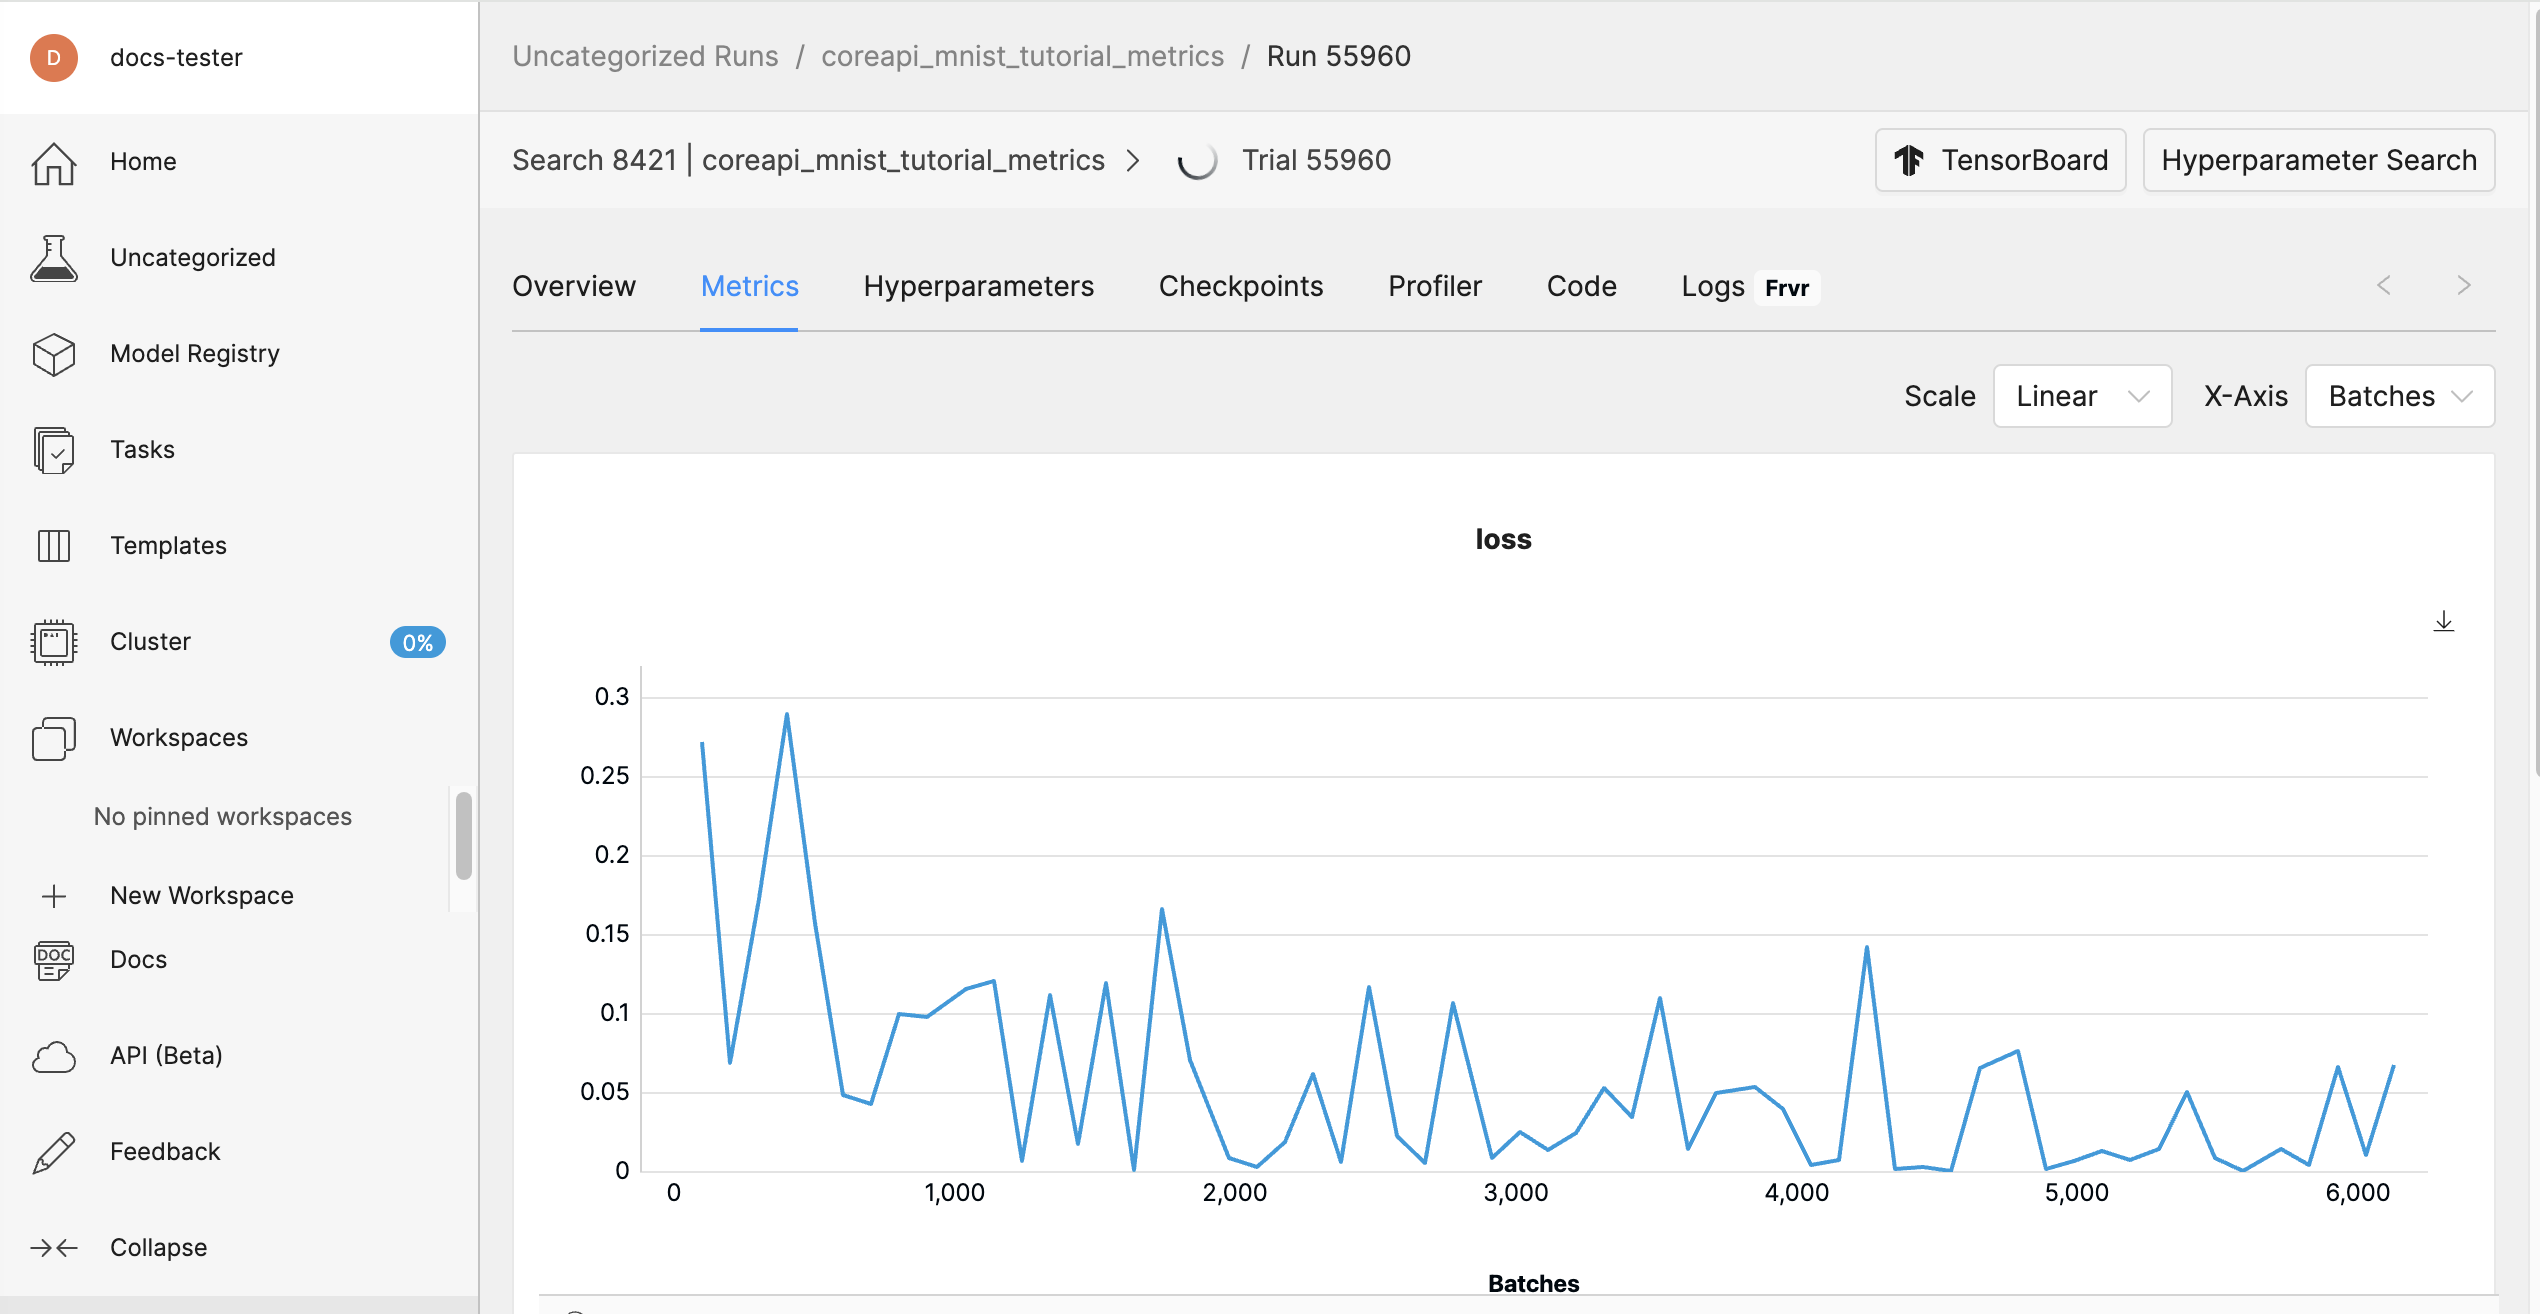
In this step, you learned how to add a few new lines of code in order to report training and validation metrics to the Determined master. Next, we’ll modify our script to report checkpoints.
Step 3: Checkpointing#
Checkpointing periodically during training and reporting the checkpoints to the master gives us the ability to stop and restart training. In this section, we’ll modify our script for the purpose of checkpointing.
In this step, we’ll run our experiment using the model_def_checkpoints.py script and its
accompanying checkpoints.yaml experiment configuration file.
Note
For this tutorial, we’ve already created the script for you. Take a moment to review the changes we’ve made to the provided script so that you’ll know how to modify your own script.
To run the experiment, you can either use the provided scripts, which have already been modified, or you can build your own file by making changes to “model_def.py”.
Step 3.1: Save Checkpoints#
To save checkpoints, add the store_path function to your script:
# NEW: Save checkpoint.
checkpoint_metadata_dict = {"steps_completed": steps_completed}

# NEW: Here we are saving multiple files to our checkpoint
# directory. 1) a model state file and 2) a file includes
# information about the training loop state.
with core_context.checkpoint.store_path(checkpoint_metadata_dict) as (path, storage_id):
    torch.save(model.state_dict(), path / "checkpoint.pt")
    with path.joinpath("state").open("w") as f:
        f.write(f"{epochs_completed},{info.trial.trial_id}")
Step 3.2: Continuations#
There are two types of continuations: pausing and reactivating training using the WebUI or clicking Continue Trial after the experiment completes.
These two types of continuations have different behaviors. While you always want to preserve the model’s state, you do not always want to preserve the batch index. When you pause and reactivate you want training to continue from the same batch index, but when starting a fresh experiment you want training to start with a fresh batch index. You can save the trial ID in the checkpoint and use it to distinguish the two types of continuations.
To distinguish between the two types of continuations, you can save the trial ID in the checkpoint.
Enable Pausing and Resuming an Experiment
To enable pausing an experiment, enable preemption:
# NEW: Detect when the experiment is paused by the WebUI.
if core_context.preempt.should_preempt():
    return
Define a load_state function for restarting model training from existing checkpoint:
# NEW: Define load_state function for restarting model training from
# existing checkpoint. Returns (.pt, int).
# Also update load_state header to take trial info object as an argument.
def load_state(checkpoint_directory, trial_id):
    checkpoint_directory = pathlib.Path(checkpoint_directory)

    with checkpoint_directory.joinpath("checkpoint.pt").open("rb") as f:
        model = torch.load(f)
    with checkpoint_directory.joinpath("state").open("r") as f:
        epochs_completed, ckpt_trial_id = [int(field) for field in f.read().split(",")]
    # Docs snippet start: compare checkpoint and current trial IDs
    # If trial ID does not match our current trial ID, we'll ignore
    # epochs completed and start training from epoch_idx = 0
    if ckpt_trial_id != trial_id:
        epochs_completed = 0
    # Docs snippet end: compare checkpoint and current trial IDs

    return model, epochs_completed
If checkpoint exists, load it and assign it to model state prior to resuming training:
# NEW: If checkpoint exists, load it and assign it to model state
# prior to resuming training.
info = det.get_cluster_info()
assert info is not None, "this example only runs on-cluster"
latest_checkpoint = info.latest_checkpoint
if latest_checkpoint is None:
    epochs_completed = 0
else:
    with core_context.checkpoint.restore_path(latest_checkpoint) as path:
        model, epochs_completed = load_state(path, info.trial.trial_id)
Enable Continuing the Trial
To enable continuing the trial after the experiment completes, save the trial ID. One way to do this is to load the checkpoint and save the checkpoint in a file in the checkpoint directory.
Open the checkpoint.pt file in binary mode and compare ckpt_trial_id with the current
trial_id:
# If trial ID does not match our current trial ID, we'll ignore
# epochs completed and start training from epoch_idx = 0
if ckpt_trial_id != trial_id:
    epochs_completed = 0
Save the checkpoint in the checkpoint.pt file:
# NEW: Save checkpoint.
checkpoint_metadata_dict = {"steps_completed": steps_completed}

# NEW: Here we are saving multiple files to our checkpoint
# directory. 1) a model state file and 2) a file includes
# information about the training loop state.
with core_context.checkpoint.store_path(checkpoint_metadata_dict) as (path, storage_id):
    torch.save(model.state_dict(), path / "checkpoint.pt")
    with path.joinpath("state").open("w") as f:
        f.write(f"{epochs_completed},{info.trial.trial_id}")
Detect when the experiment is paused by the WebUI:
# NEW: Detect when the experiment is paused by the WebUI.
if core_context.preempt.should_preempt():
    return
Step 3.3: Run the Experiment#
Run the following command to run the experiment:
det e create checkpoints.yaml . -f
In the Determined WebUI, nagivate to the experiment’s Checkpoints tab.
Checkpoints are saved and deleted according to the default Checkpoint Policy. You can modify the checkpoint policy in the experiment configuration file.
Step 4: Hyperparameter Search#
With the Core API you can run advanced hyperparameter searches with any training loop. The hyperparameter search logic is in the master, which can create trials and can decide to preempt them if they are underpeforming.
To perform a hyperparameter search, we’ll update our script to define the hyperparameter search settings we want to use for our experiment. More specifically, we’ll need to define the following settings in our experiment configuration file:
name: adaptive_asha(name of our searcher. For all options, visit Search Methods).metric: test_losssmaller_is_better: true(This is equivalent to minimization vs. maximization of objective.)max_trials: 50(This is the maximum number of trials the searcher should run.)time_metric: epochs(This is the name of the “time” metric which we report in validation metrics).max_time: 20(The max number of epochs a trial will report. For more information, visit Adaptive ASHA in the Experiment Configuration Reference.
In addition, we also need to define the hyperparameters themselves. Adaptive ASHA will pick values
between the minval and maxval for each hyperparameter for each trial.
In this step, we’ll run our experiment using the model_def_adaptive.py script and its
accompanying adaptive.yaml experiment configuration file.
Note
For this tutorial, we’ve already created the script for you. Take a moment to review the changes we’ve made to the provided script so that you’ll know how to modify your own script.
To run the experiment, you can either use the provided scripts, which have already been modified, or you can build your own file by making changes to “model_def.py”.
Begin by accessing the hyperparameters in your code:
# NEW: Get hparams chosen for this trial from cluster info object.
hparams = info.trial.hparams
Then, pass the hyperparameters into your model and optimizer:
# NEW: Pass relevant hparams to model and optimizer.
model = Net(hparams).to(device)
optimizer = optim.Adadelta(model.parameters(), lr=hparams["learning_rate"])
Ensure your model is set to use the selected values on a per-trial basis rather than your previously hardcoded values:
# NEW: Add hparams to __init__.
def __init__(self, hparams):
    # NEW: Read hyperparameters provided for this trial.
    super(Net, self).__init__()
    self.conv1 = nn.Conv2d(1, hparams["n_filters1"], 3, 1)
    self.conv2 = nn.Conv2d(hparams["n_filters1"], hparams["n_filters2"], 3, 1)
    self.dropout1 = nn.Dropout(hparams["dropout1"])
    self.dropout2 = nn.Dropout(hparams["dropout2"])
    self.fc1 = nn.Linear(144 * hparams["n_filters2"], 128)
    self.fc2 = nn.Linear(128, 10)
Lastly, to comply with the requirements of the ASHA search, we must report an epochs metric with
our validation metrics, since we set time_metric: epochs in our searcher:
core_context.train.report_validation_metrics(
    steps_completed=steps_completed,
    metrics={"test_loss": test_loss, "epochs": epochs_completed},
)
Step 4.1: Run the Experiment#
Run the following command to run the experiment:
det e create adaptive.yaml .
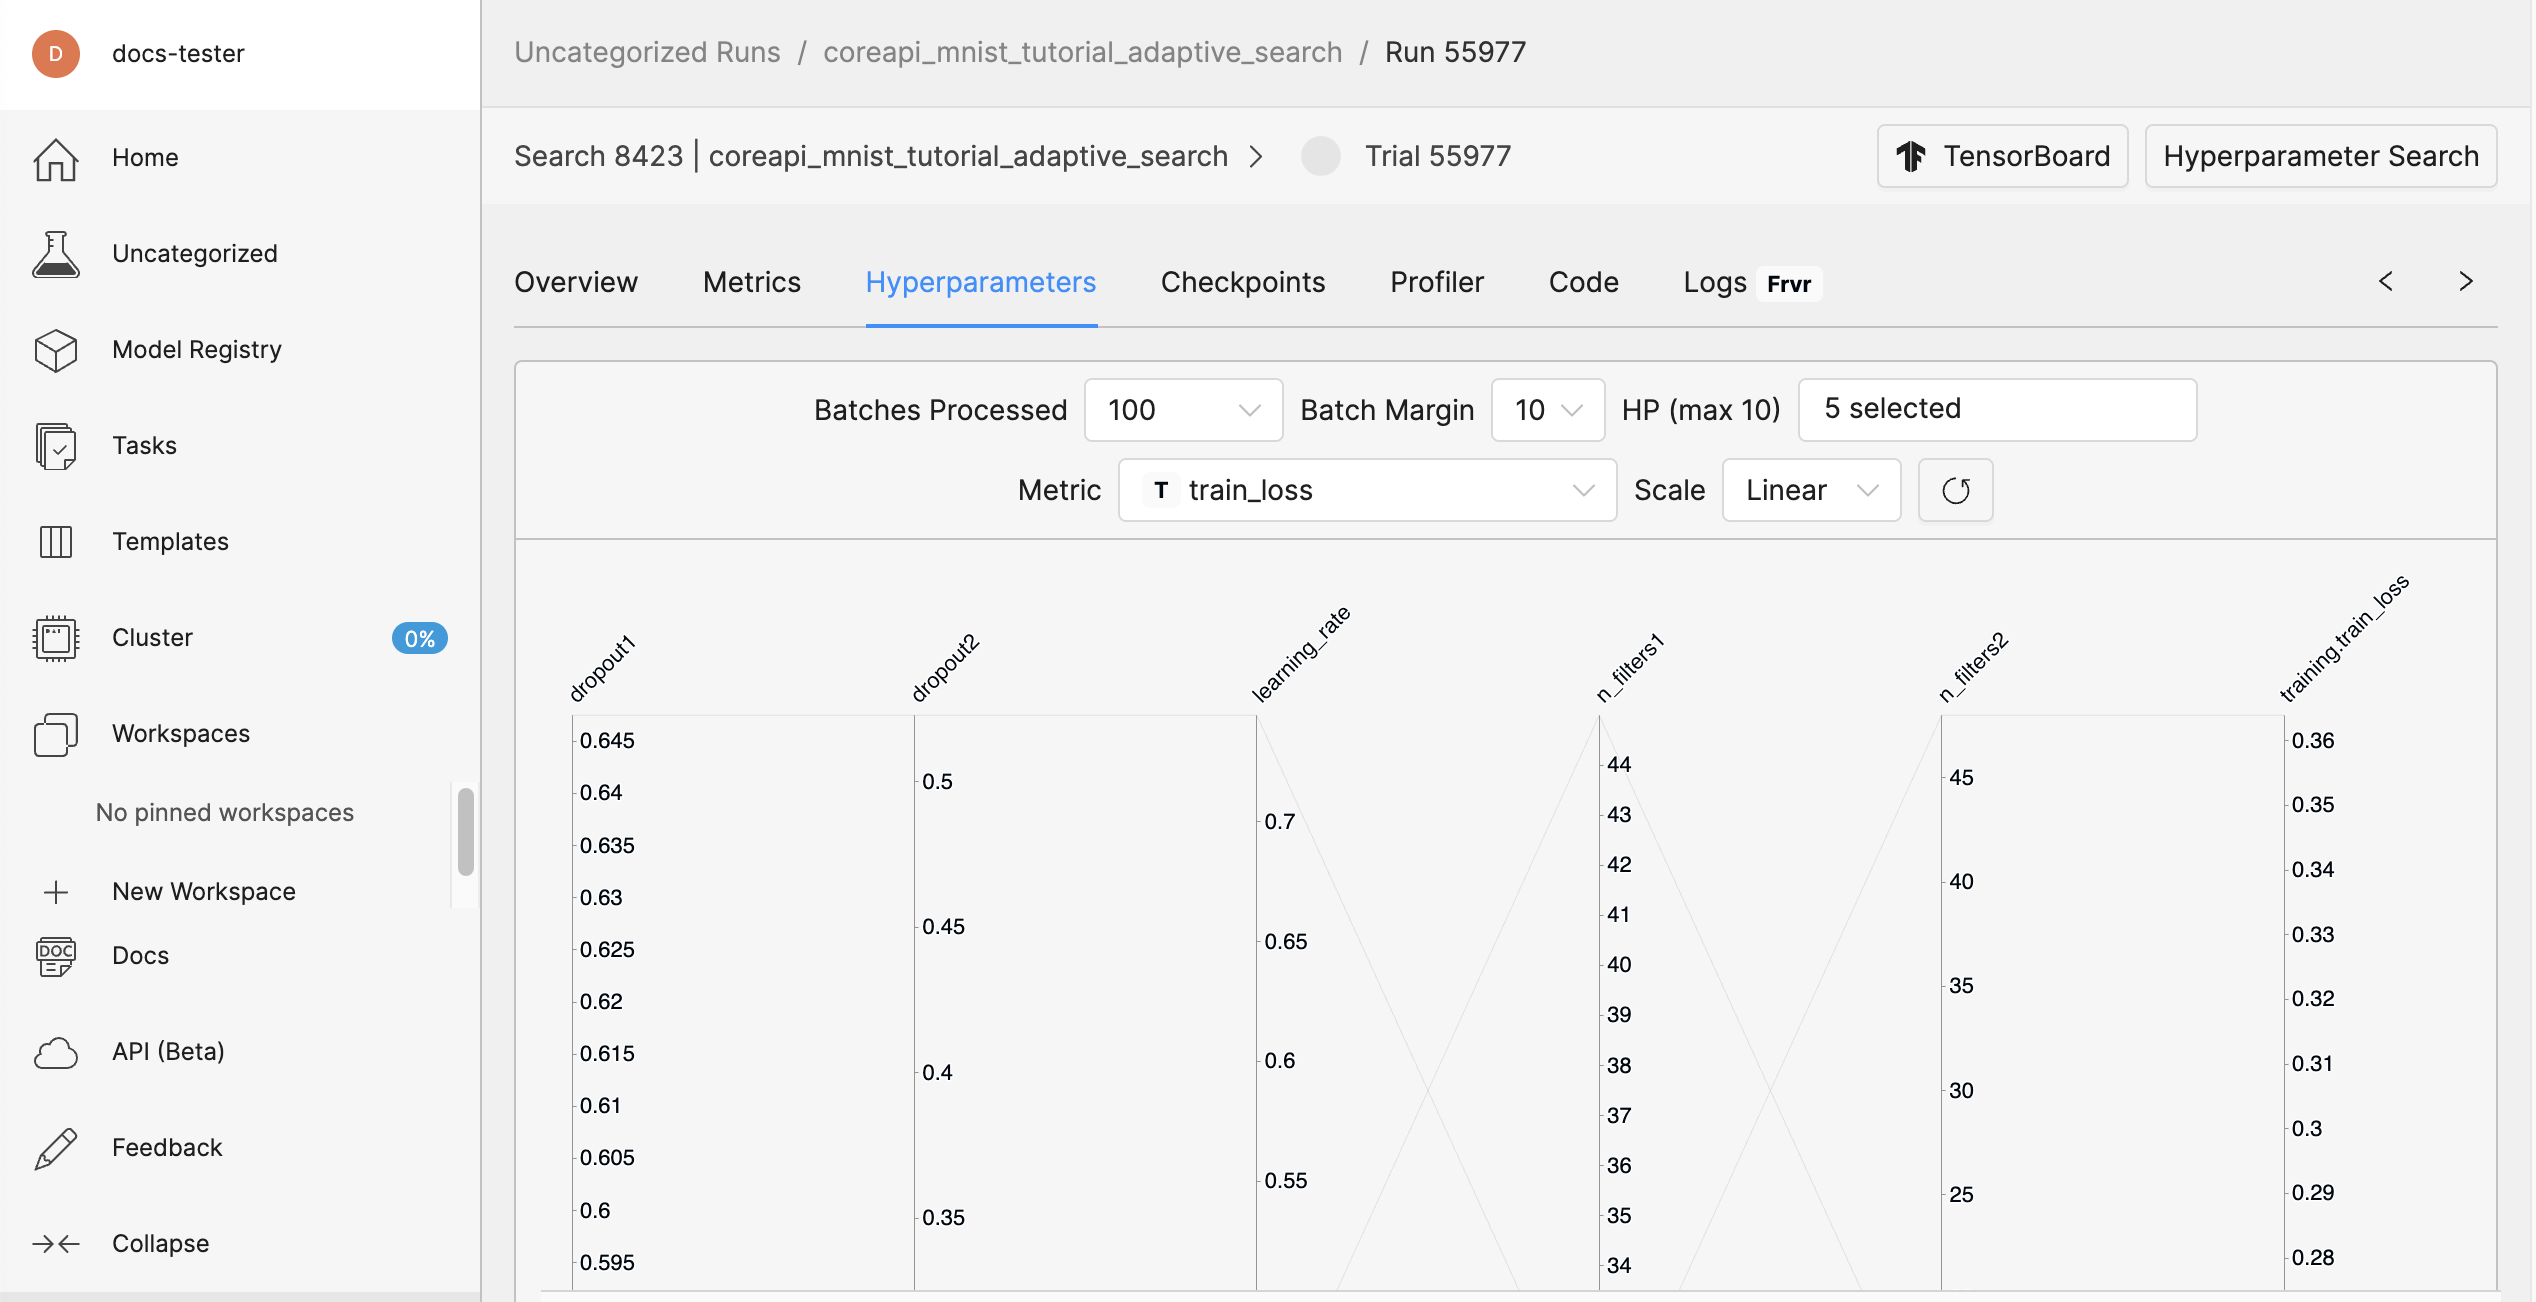
In the Determined WebUI, navigate to the experiment’s Hyperparameters tab.
You should see a graph in the WebUI that displays the various trials initiated by the Adaptive ASHA hyperparameter search algorithm.
Step 5: Distributed Training#
The Core API has special features for running distributed training. Some of the more important features are:
Access to all IP addresses of every node in the Trial (through the ClusterInfo API).
Communication primitives such as
allgather(),gather(), andbroadcast()to give you out-of-the-box coordination between workers.Since many distributed training frameworks expect all workers in training to operate in-step, the
should_preempt()call is automatically synchronized across workers so that all workers decide to preempt or continue as a unit.
Tip
Launchers
Typically, you do not have to write your own launcher. Determined provides launchers for Horovod, torch.distributed, and DeepSpeed. For more information about launcher options, visit Create and Submit an Experiment.
In this example, we’ll be using PyTorch’s DistributedDataParallel. We’ll also need to make specific changes to our configuration experiment file.
In this step, we’ll run our experiment using the model_def_distributed.py script and its
accompanying distributed.yaml experiment configuration file.
Note
For this tutorial, we’ve already created the script for you. Take a moment to review the changes we’ve made to the provided script so that you’ll know how to modify your own script.
To run the experiment, you can either use the provided scripts, which have already been modified, or you can build your own file by making changes to “model_def.py”.
Step 5.1: Edit Your Experiment Configuration File#
Edit your experiment configuration file to point to a launch script:
entrypoint: >-
   python3 -m determined.launch.torch_distributed
   python3 model_def_distributed.py
and, set slots_per_trial (under resources) to the number of GPUs you want to distribute the
training across:
resources:
  slots_per_trial: 4
Step 5.2: Modify Your Training Script#
Add a few more imports to your training script:
# NEW: Import torch distributed libraries.
import torch
import torch.distributed as dist
import torch.nn as nn
import torch.nn.functional as F
import torch.optim as optim
from torch.nn.parallel import DistributedDataParallel as DDP
from torch.optim.lr_scheduler import StepLR
from torch.utils.data.distributed import DistributedSampler
from torchvision import datasets, transforms

import determined as det
Initialize a process group using torch. After initializing a process group, initialize a
Determined distributed context using from_torch_distributed:
if __name__ == "__main__":
    # NEW: Initialize process group using torch.
    dist.init_process_group("nccl")

    # NEW: Initialize distributed context using from_torch_distributed
    # (obtains info such as rank, size, etc. from default torch
    # environment variables).
    distributed = det.core.DistributedContext.from_torch_distributed()
    with det.core.init(distributed=distributed) as core_context:
        main(core_context)
In main, set your selected device to the device with index of local_rank. This is a best
practice even if you only have a single GPU-per-node setup:
Note
Refer to the if use_cuda: block in model_def_distributed.py
    # NEW: Change selected device to the one with index of local_rank.
    device = torch.device(core_context.distributed.local_rank)
elif use_mps:
    device = torch.device("mps")
else:
    device = torch.device("cpu")
Shard the data into num_replicas non-overlapping parts. num_replicas is equal to
core_context.distributed.size, or the number of slots:
# NEW: Create DistributedSampler object for sharding data into
# core_context.distributed.size parts.
train_sampler = DistributedSampler(
    train_dataset,
    num_replicas=core_context.distributed.size,
    rank=core_context.distributed.rank,
    shuffle=True,
)
test_sampler = DistributedSampler(
    test_dataset,
    num_replicas=core_context.distributed.size,
    rank=core_context.distributed.rank,
    shuffle=True,
)

# NEW: Shard data.
train_loader = torch.utils.data.DataLoader(train_dataset, sampler=train_sampler, **train_kwargs)
test_loader = torch.utils.data.DataLoader(test_dataset, sampler=test_sampler, **test_kwargs)
Wrap your model with torch’s DistributedDataParallel:
model = Net(hparams).to(device)
# NEW: Wrap model with DDP. Aggregates gradients and synchronizes
# model training across slots.
model = DDP(model, device_ids=[device], output_device=device)
Finally, at each place in the code where you upload checkpoints, report training metrics, or report progress to the master, make sure this is done only on rank 0, e.g.,:
# NEW: Report metrics only on rank 0: only the chief worker
# may report training metrics and progress, or upload checkpoints.
if core_context.distributed.rank == 0:
    core_context.train.report_training_metrics(
        steps_completed=(batch_idx + 1) + epoch_idx * len(train_loader),
        metrics={"train_loss": loss.item()},
    )
Step 5.3: Run the Experiment#
Run the following command to run the experiment:
det e create distributed.yaml .
In the Determined WebUI, go to the Cluster pane in the left navigation.
You should be able to see multiple slots active corresponding to the value you set for
slots_per_trial you set in distributed.yaml, as well as logs appearing from multiple ranks.
Profiling#
There are two ways to profile the performance of your training job:
Core API’s built-in system metrics profiler
#. Integration with profilers native to your training framework, such as the TensorFlow and PyTorch profilers
Core API Profiler#
The Core API includes a profiling feature that monitors and records system metrics during the training run. These metrics are recorded at specified intervals and sent to the master, allowing you to view them in the “Profiling” tab of your experiment in the WebUI.
Use ProfilerContext to interact with the Core API profiler. It can be
toggled on or off by calling on() and
off(). on() accepts
optional parameters that configure the rate (in seconds) at which system metrics are sampled
(sampling_interval) and the number of samples to average before reporting
(samples_per_report). By default, the profiler samples every 1 second and reports the aggregate
of every 10 samples.
The following code snippet demonstrates how to enable profiling for only a portion of your training
code, but the profiler can be turned on and off at any point within the core.Context.
import determined as det


with det.core.init() as core_context:
    ...
    for batch_idx in range(1, 10):
        # In this example we just want to profile the first 5 batches.
        if batch_idx == 1:
            core_context.profiler.on()
        if batch_idx == 5:
            core_context.profiler.off()
        train_batch(...)
Native Profilers#
Profiling with native profilers such as PyTorch profiler and TensorFlow profiler can be configured as usual. If running on a Determined cluster, the profiling log output path can be configured for automatic upload to the Determined TensorBoard UI.
The following snippet initializes the PyTorch Profiler. It will profile GPU and CPU activities, skipping batch 1, warming up on batch 2, profiling batches 3 and 4, then repeating the cycle. Result files will be uploaded to the experiment’s TensorBoard path and can be viewed under the “PyTorch Profiler” tab in the Determined TensorBoard UI.
See PyTorch Profiler documentation for details.
import torch
import determined as det


with det.core.init() as core_context:
    ...
    profiler = torch.profiler.profile(
        on_trace_ready=torch.profiler.tensorboard_trace_handler(
            str(core_context.train.get_tensorboard_path())
        ),
        activities=[
            torch.profiler.ProfilerActivity.CPU,
            torch.profiler.ProfilerActivity.CUDA,
        ],
        schedule=torch.profiler.schedule(wait=1, warmup=1, active=2),
    )

# Step the profiler on each train batch call.
train_batch(...)
with profiler:
    profiler.step()
Note
While specifying batches to profile with profile_batch is optional, profiling every batch can generate a large amount of data, causing long rendering times and potential memory issues in TensorBoard. For long-running experiments, it’s advised to profile only specific batches.
Next Steps#
In this user guide, you learned how to use the Core API to integrate a model into Determined. You also saw how to modify a training script and use the appropriate configuration file to report metrics and checkpointing, perform a hyperparameter search, and run distributed training.
Note
To learn more about distributed training with Determined, visit the conceptual overview or the intro to implementing distributed training.