Kubernetes Observability#
This guide provides recommendations and assists in setting up monitoring for a Determined installation on Kubernetes.
Prerequisites#
Determined must be running within a Kubernetes cluster.
The Helm value
observability.enable_prometheusmust be set totrue(this is the default setting).CLI must be installed.
Kubectlmust be installed and configured appropriately.
Configuration Steps#
Create a Namespace#
Run the following command to create a namespace called
det-monitoring:kubectl create ns det-monitoring
Change Directory#
Clone the repository and navigate to the
tools/observabilitydirectory:git clone https://github.com/determined-ai/determined.git && \ cd determined/tools/observability
Token Refresh#
The Determined Prometheus export endpoint is secured by authentication, requiring a refreshable authentication token. Set up a cron job for token refresh as follows:
Create an account.
det -u admin user create tokenrefresher
Change the account password.
det -u admin user change-password tokenrefresher
Store the credentials.
kubectl -n det-monitoring create secret generic token-refresh-username-pass \
  --from-literal="creds=tokenrefresher:testPassword1"
Deploy a cron job.
Attention
tokenRefresher.yaml may not work work in every Kuberenetes setup. If you have a unique use
case, it might need modification. Hardcoding the Determined master IP can reduce assumptions made
by the script.
kubectl -n det-monitoring apply -f tokenRefresher.yaml
Verify “secret” creation. After a few minutes, check that the
det-prom-tokensecret was created anddet-tokenis more than 0 bytes.
kubectl -n det-monitoring describe secret det-prom-token
Install DCGM Exporter#
Depending on your environment, follow these steps for installing the DCGM exporter:
Steps for General Cloud Environments#
In general, to install DCGM in a cloud-based environment, follow the documentation for that environment.
If you are not following the steps described here for GKE as a reference, you may need to change the
additionalScrapeConfigs in the grafana-prom-values.yaml.
If you are deploying on-prem, visit Nvidia docs on installing the DCGM exporter.
Steps for GKE#
Create a namespace for the exporter.
kubectl create ns gmp-public
Apply the exporter from the GKE docs.
kubectl apply -n gmp-public -f https://raw.githubusercontent.com/GoogleCloudPlatform/prometheus-engine/main/examples/nvidia-dcgm/exporter.yaml
Create a service for the DCGM exporter.
kubectl apply -n gmp-public -f gkeDCGMExporterService.yaml
This differs from the GKE documentation because we deploy a Prometheus installation instead of using Google Cloud’s managed service. While it is still possible to use Google Cloud’s managed service, some features, such as GPU statistics by user, will not be available.
Verify the DCGM exporter is functioning by port forwarding the service and checking metrics.
kubectl -n gmp-public port-forward service/nvidia-dcgm-exporter 9400
In a new console window, verify the service.
curl 127.0.0.1:9400/metrics
Install Kube Prometheus Stack#
Follow these instructions for installing a Kube Prometheus Stack. For additional information, you can visit the Kube Prometheus stack documentation.
Add the Helm repo and update.
helm repo add prometheus-community \
  https://prometheus-community.github.io/helm-charts && \
  helm repo update
Install the Kube Prometheus Stack. You’ll need to change the password in the following command.
helm -n det-monitoring install monitor prometheus-community/kube-prometheus-stack \
  --set grafana.adminPassword=testPassword \
  --values grafana-prom-values.yaml
Set Up a Monitoring Dashboard#
This section guides you through the process of setting up monitoring dashboards for your Determined installation on Kubernetes.
Add an API monitoring dashboard.
kubectl -n det-monitoring create configmap det-api-dash --from-file api-dash.json && \
  kubectl -n det-monitoring label configmap det-api-dash grafana_dashboard=1
Add a resource utilization dashboard.
kubectl -n det-monitoring create configmap det-resource-utilization-dash --from-file resource-utilization-dash.json && \
  kubectl -n det-monitoring label configmap det-resource-utilization-dash grafana_dashboard=1
Check Prometheus operation by port forwarding.
kubectl -n det-monitoring port-forward service/monitor-kube-prometheus-st-prometheus 9090:9090
Verify metric scraping.
Go to 127.0.0.1:9090 and check that the query has two or more results with a
1value.
up{job=~"det-master-api-server|gpu-metrics"}
Access Grafana to view the dashboards.
kubectl -n det-monitoring port-forward svc/monitor-grafana 9000:80
Navigate to 127.0.0.1:9000. Sign in with the username
adminand the password you set above. You should see theDetermined API Server Monitoringdashboard.
Dashboard Example#
After submitting experiments on the cluster, you should see populated panels in the imported Grafana dashboard: Grafana -> Dashboards.
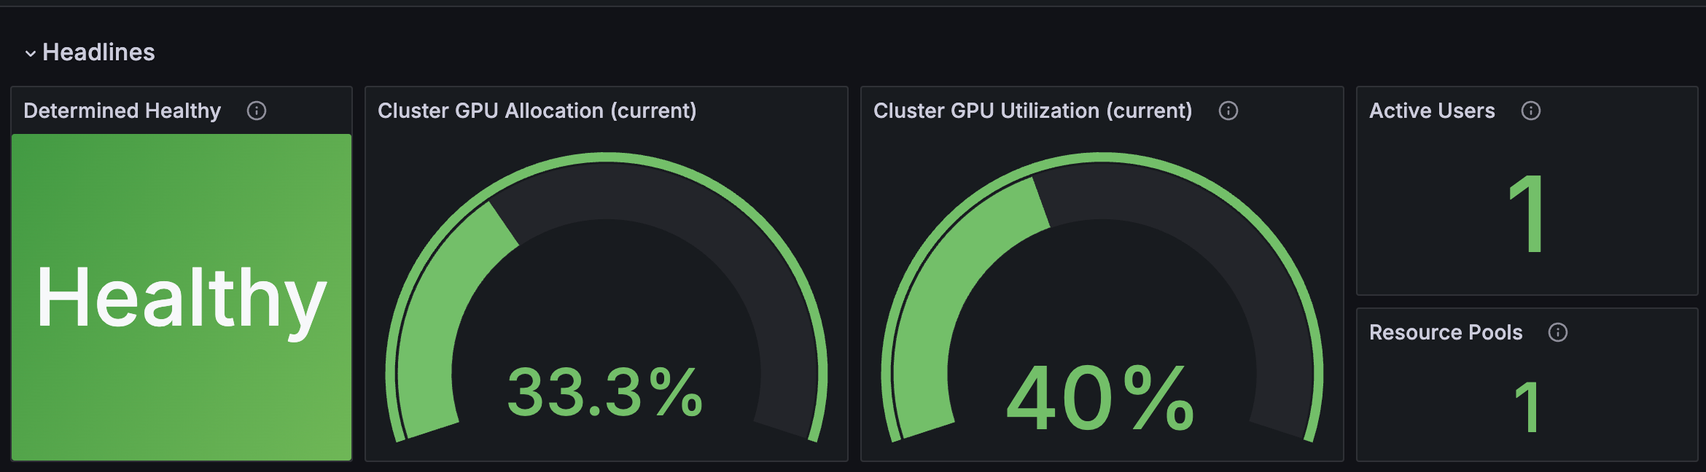
Resource Utilization Dashboard Headlines#
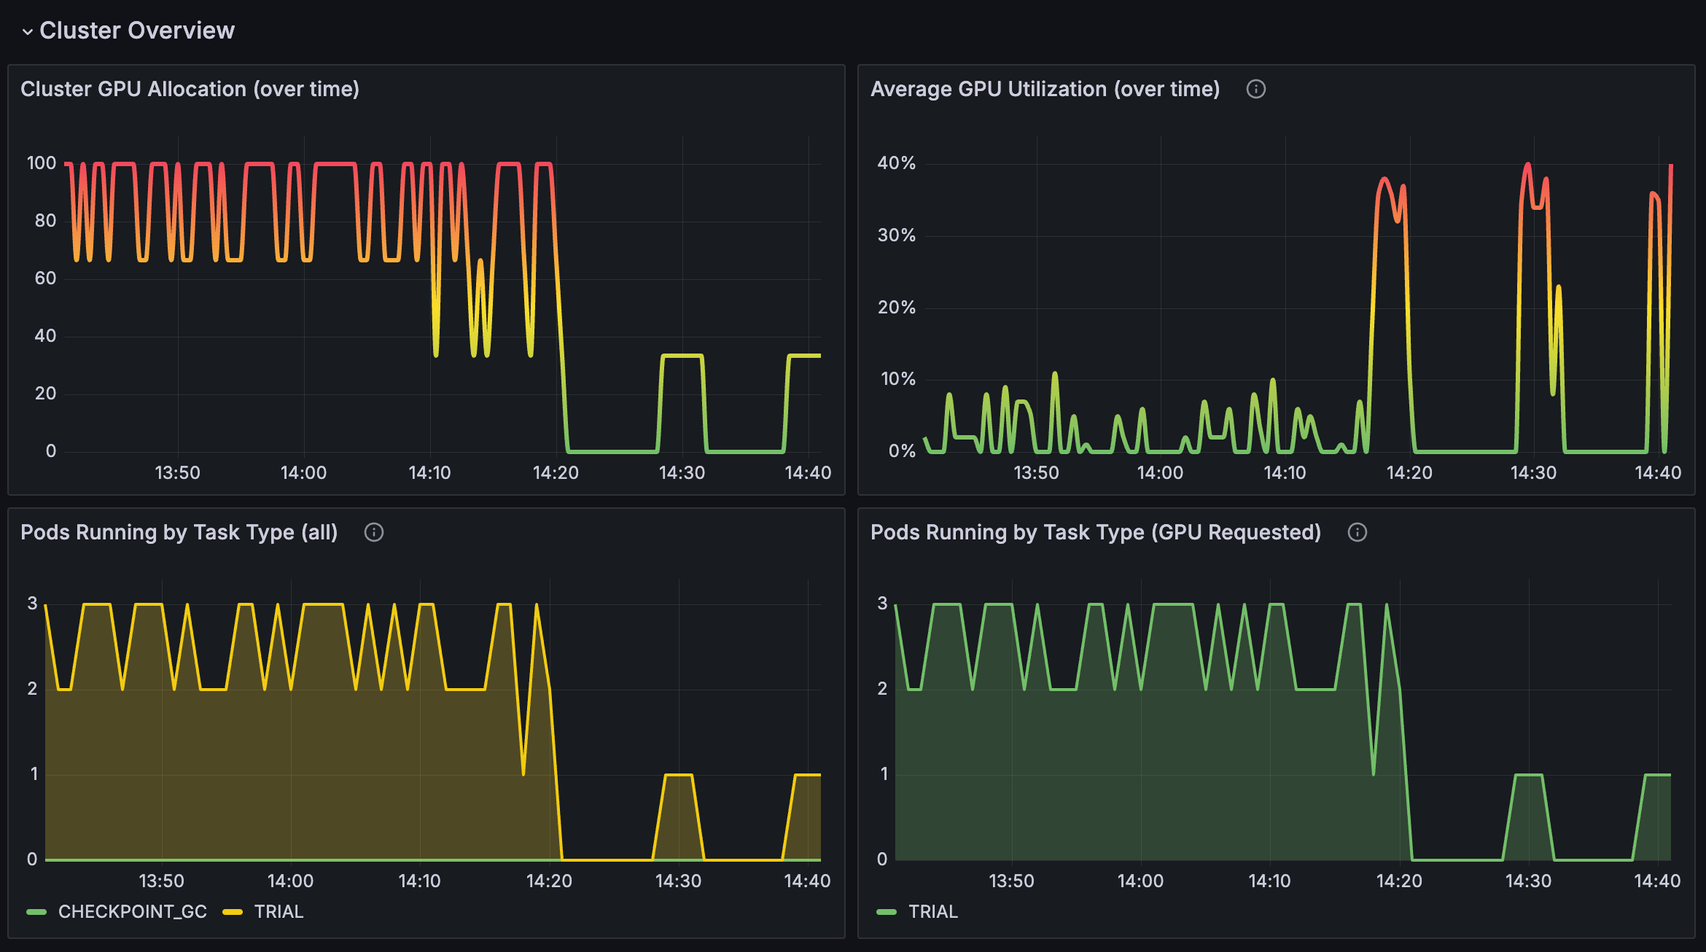
Resource Utilization Dashboard Cluster Overview#
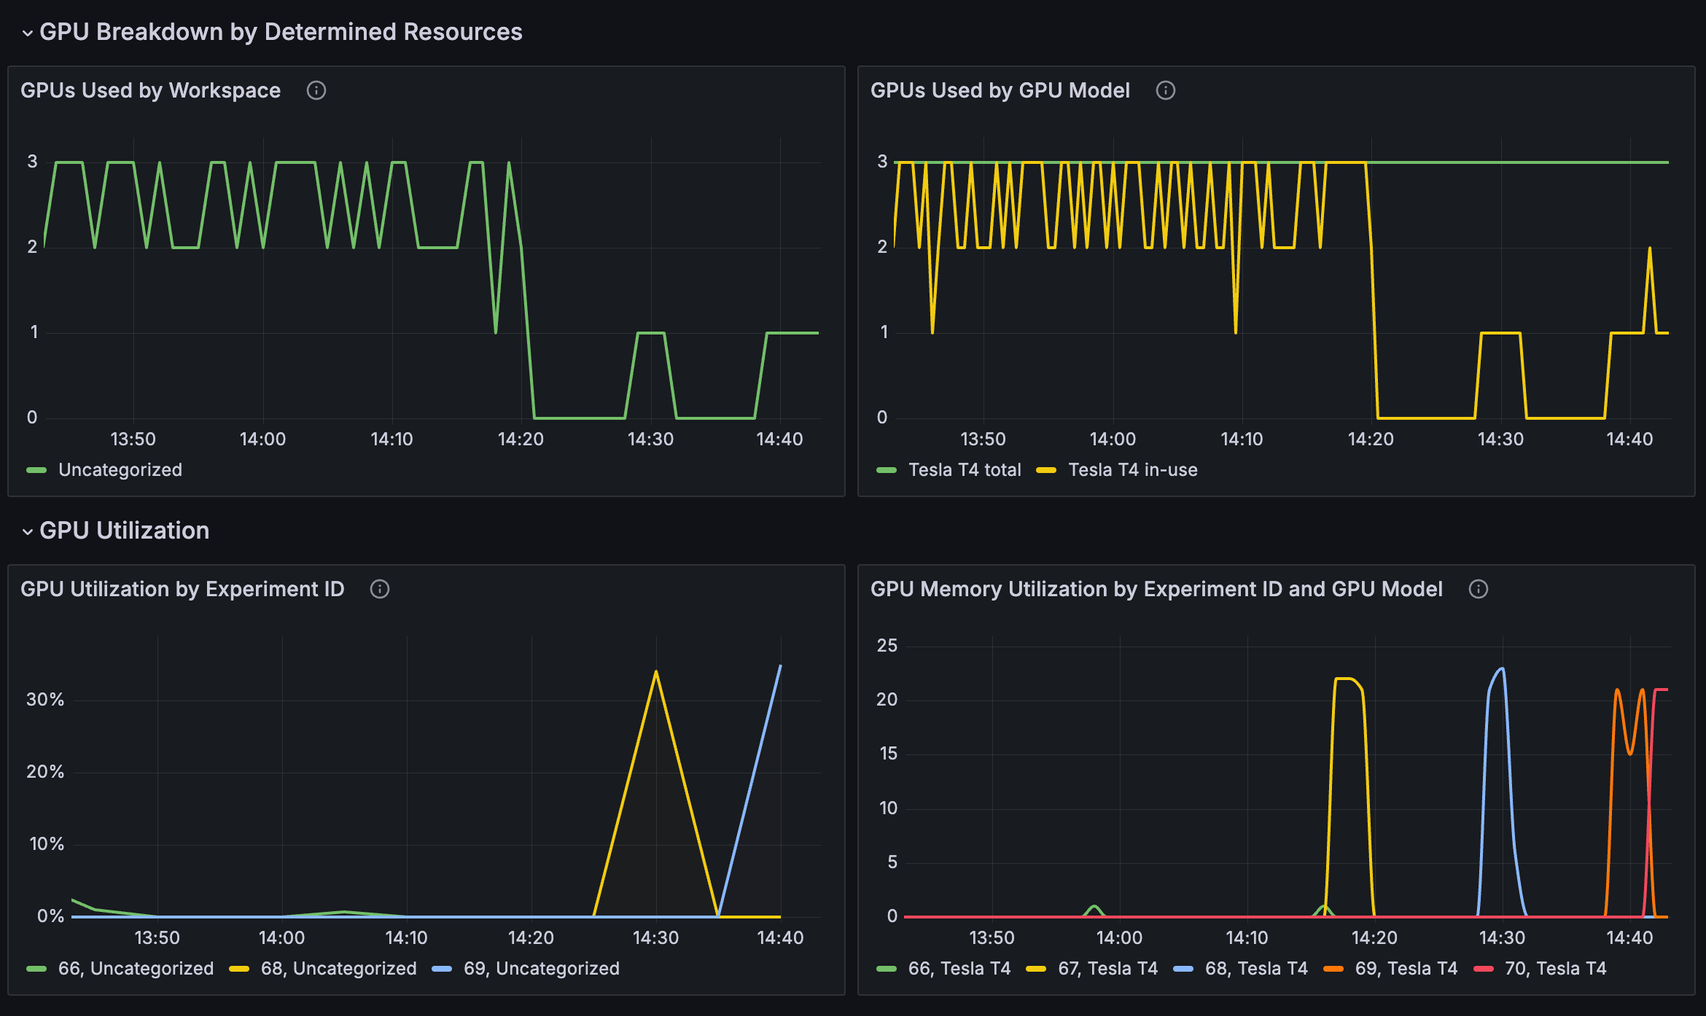
Resource Utilization Dashboard GPU Breakdown#
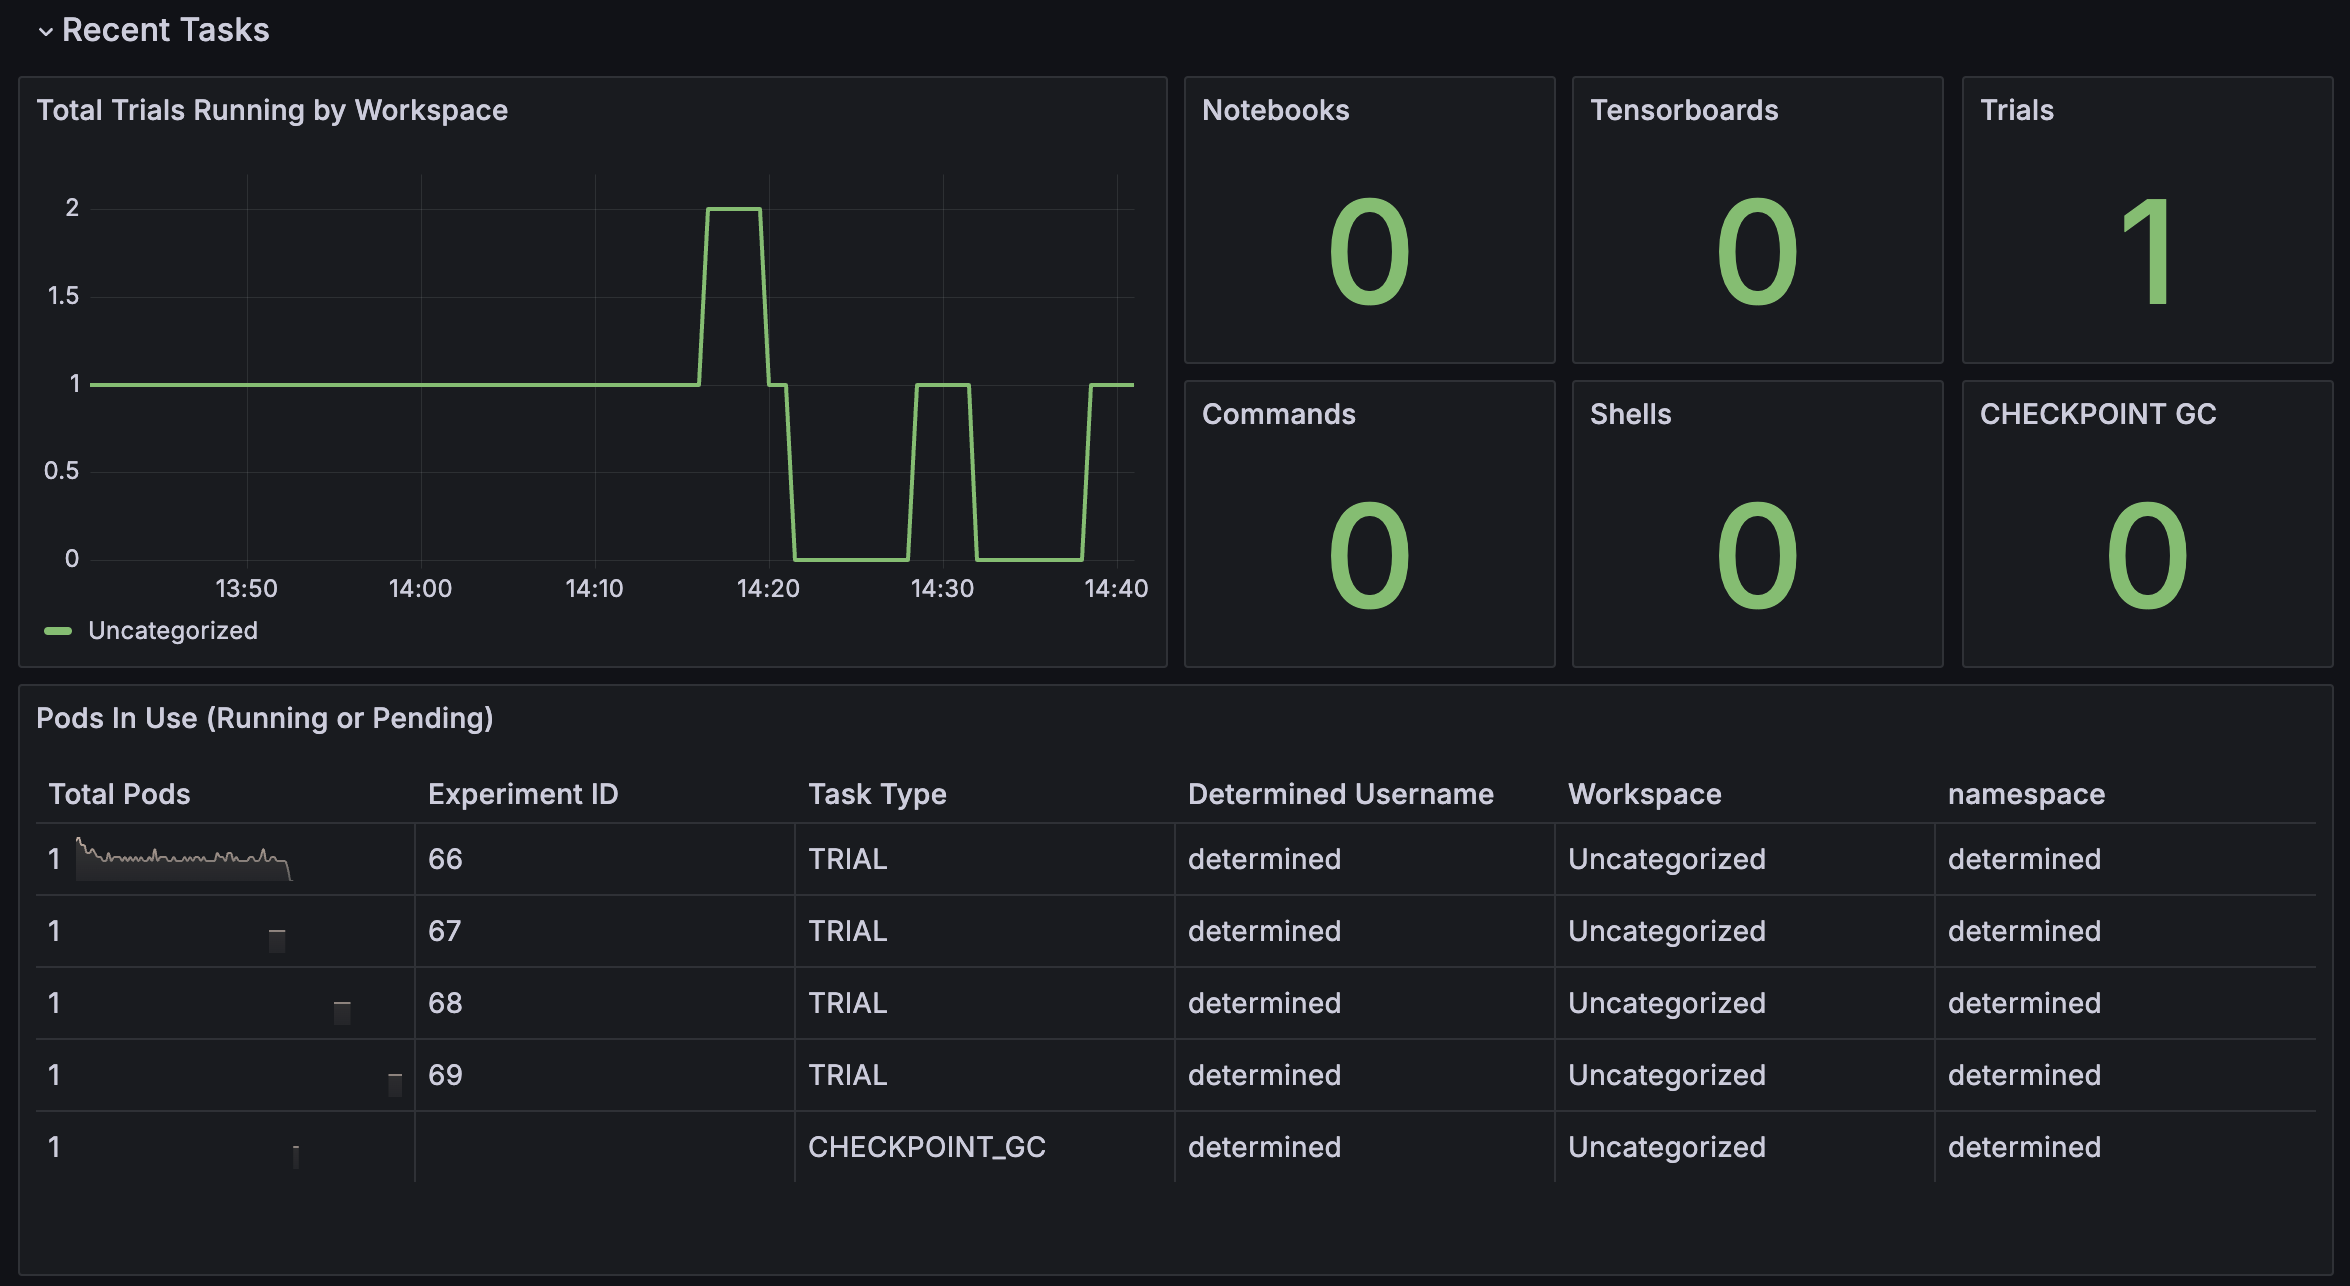
Resource Utilization Dashboard Recent Tasks#
Each panel in the dashboard is powered by one or more Prometheus queries.
Metrics#
Determined does not generate its own metrics; instead, it utilizes existing tools to report information.
API Performance Metrics#
Determined master reports API performance metrics using grpc ecosystem.
Kubernetes and Container Metrics#
The kube-prometheus-stack enables kube-state-metrics and cAdvisor by default.
kube-state-metrics reports the state of kubernetes objects, including those created by Determined.
cAdvisor reports the resource usage and performance of running containers, including metrics such as memory and CPU usage.
Nvidia DCGM Exporter#
Nvidia’s Data Center GPU Manager (DCGM) collects data on Nvidia GPUs.
Health Status#
Determined master reports a metric, determined_healthy, with value of 1 when major
dependencies are reachable, and 0 otherwise. Visit Alerts for
information on how to set up alerts.
Viewing Metrics#
The Determined Master assigns specific state values to the pods it creates. These pod labels can be
accessed via the kube_pod_labels metric from “kube-state-metrics”. Label names are formatted as
label_determined_ai_<label_name>, such as label_determined_ai_container_id.
Kubernetes restricts pod labels to alphanumeric characters, underscores, hyphens, and dots. Any
other characters in Determined resource names will be converted underscores (_) before being
added as a pod label. Names longer than 63 characters will be truncated.
Label Key |
Label Value |
|---|---|
determined.ai/container_id |
|
determined.ai/experiment_id |
|
determined.ai/resource_pool |
name of the resource pool, including |
determined.ai/task_id |
|
determined.ai/task_type |
Determined task type, e.g. |
determined.ai/trial_id |
|
determined.ai/user |
Determined username that initiated the request |
determined.ai/workspace |
name of the workspace, including
|
PromQL Example Query#
Kubernetes resource metrics and GPU metrics can be broken down by Determined resources by joining
data metrics with the kube_pod_labels state metric. As an example, the following PromQL query
computes the average GPU Utilization by Determined experiment ID.
avg by (label_determined_ai_experiment_id)(
   DCGM_FI_DEV_GPU_UTIL * on(pod) group_left(label_determined_ai_experiment_id)
   kube_pod_labels{label_determined_ai_experiment_id!=""}
)
Additional Resources#
For more details on metric operations:
Learn about joining metrics from kube-state-metrics.
Discover how to perform vector matching in Prometheus queries.