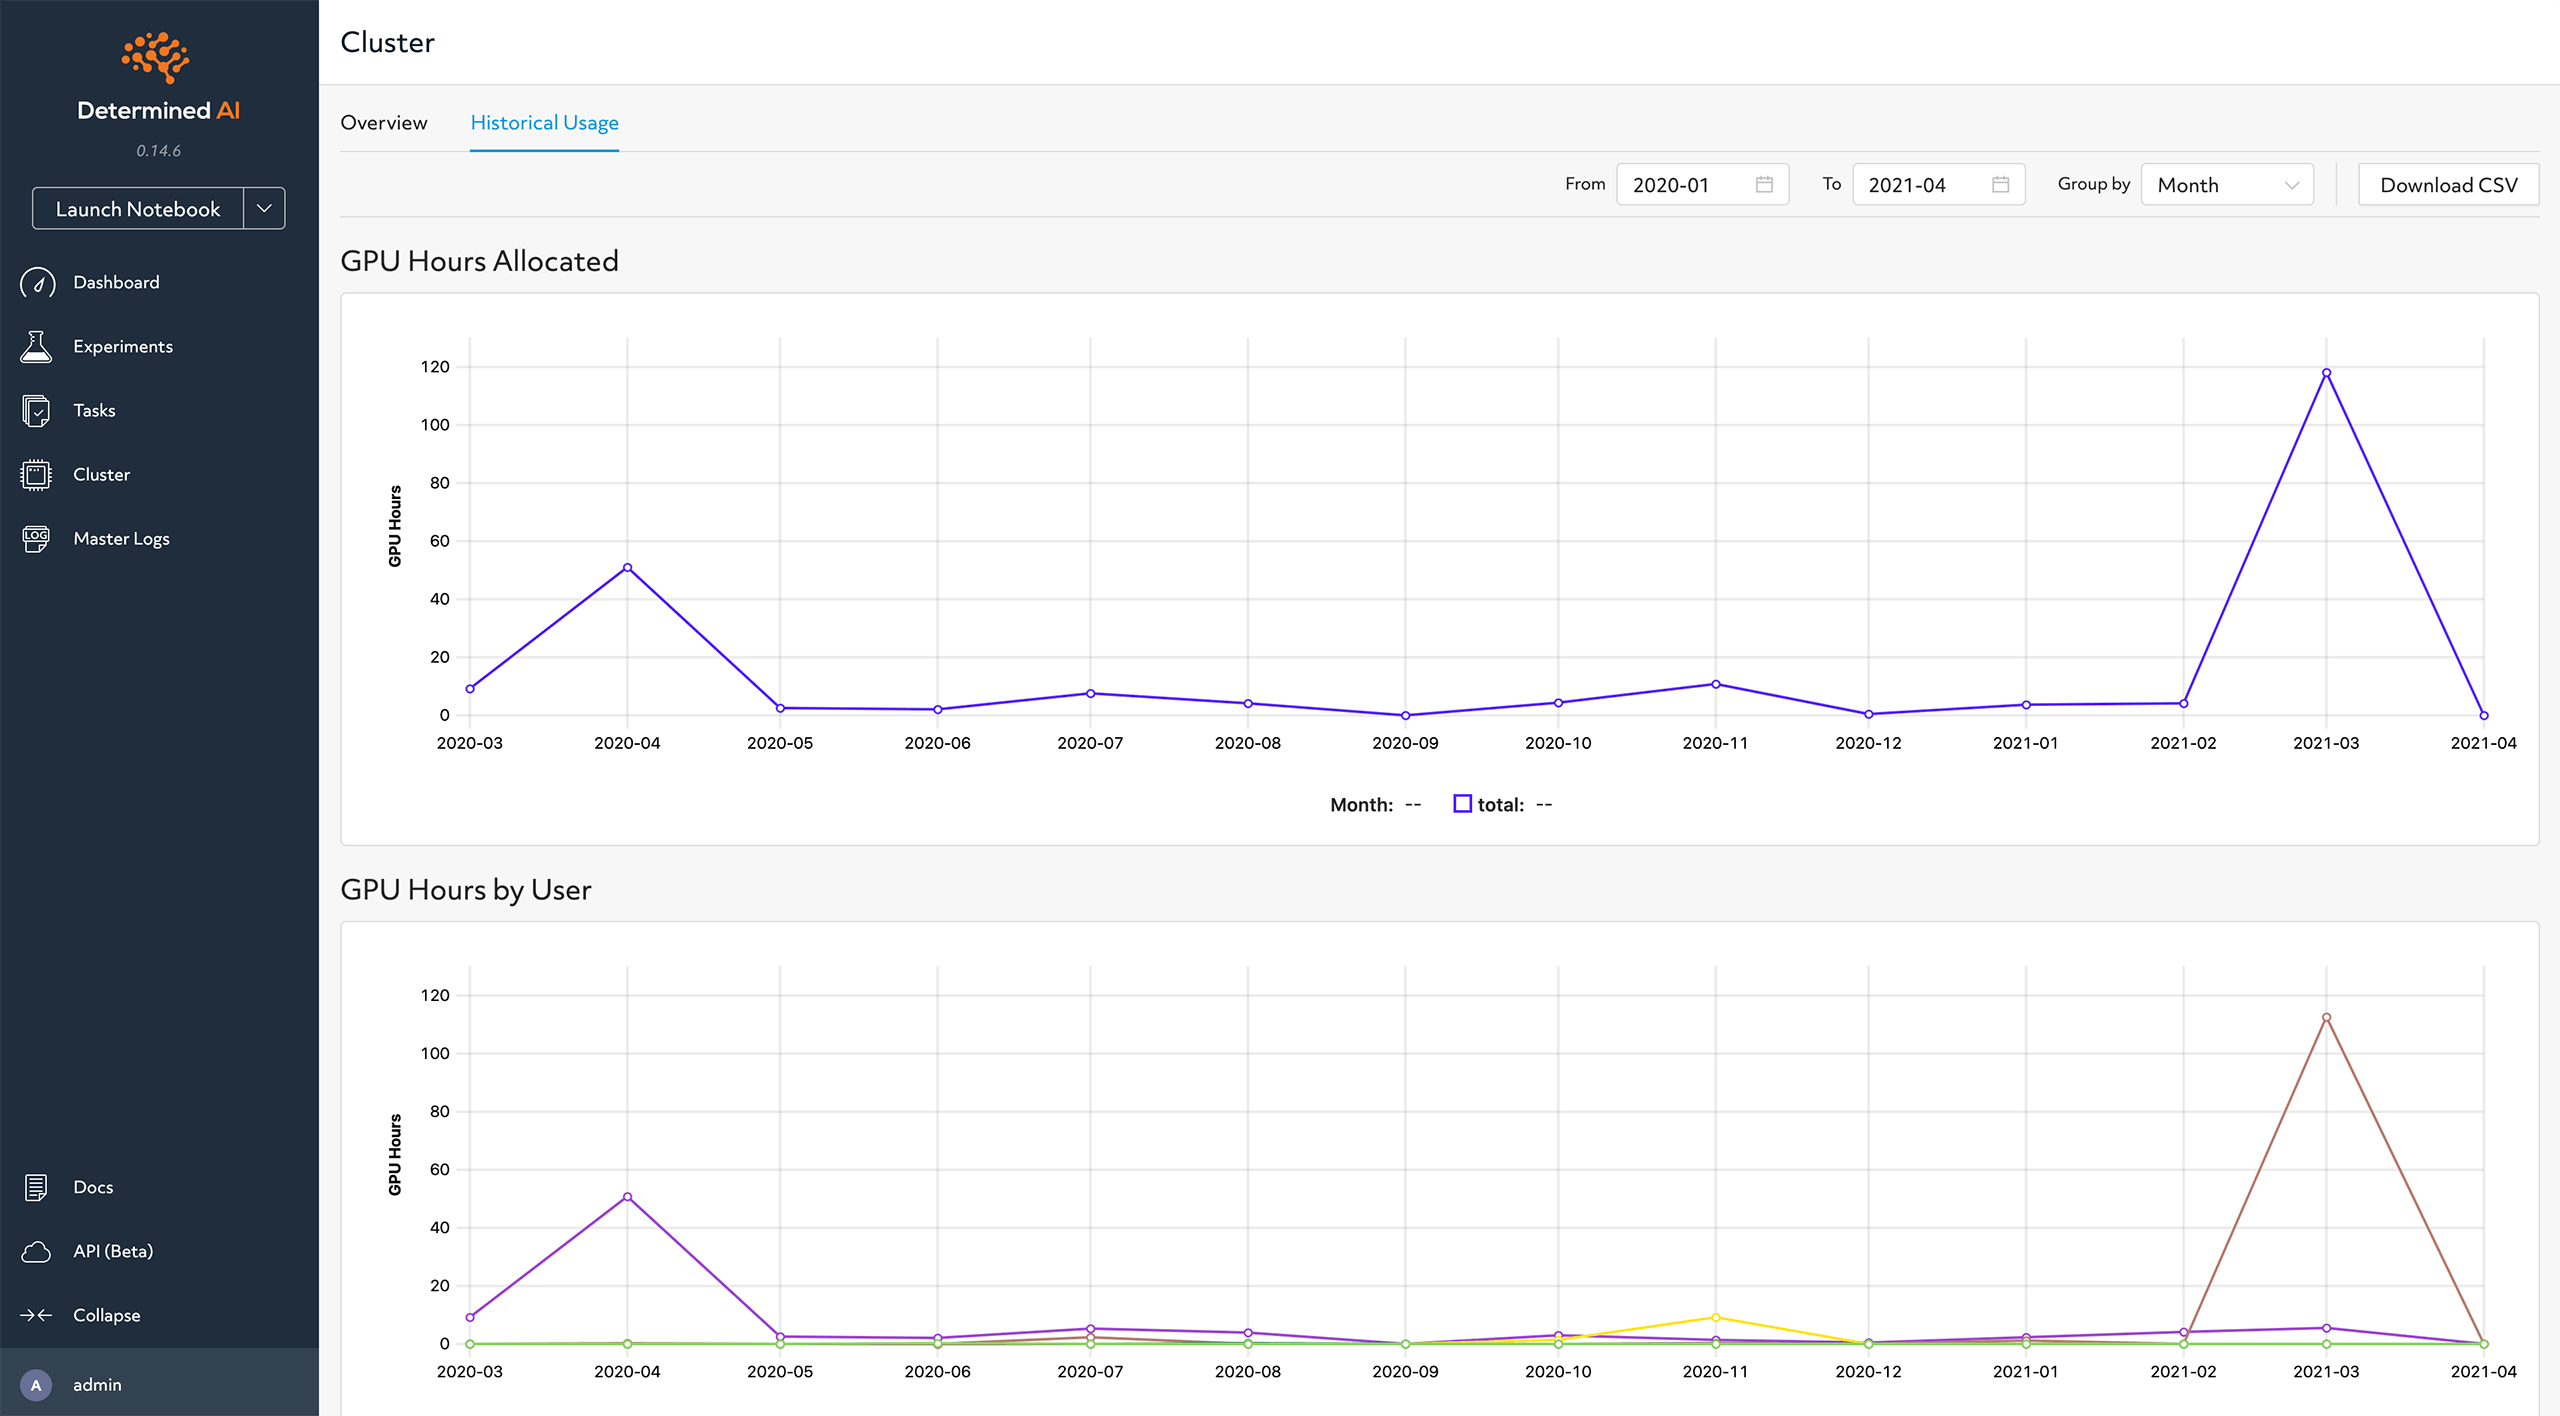
Historical Cluster Usage Data
Our goal is to give users insights on how their Determined cluster is used. To do so, we provide two features: Web UI visualizations for a quick snapshot of usage and API endpoints to download their resource allocation data for their own analysis.
Resource allocation is measured in the number of GPU hours allocated by Determined. This has two important limitations. Importantly, this is not resource utilization, so if a user gets 1 GPU allocated but only utilizes 20% of the GPU, we would still report one GPU hour. Also, this does not include time the GPU is idle (e.g., time waiting for a GPU to spin up, or when a GPU is sitting idle and not deallocated yet). For that reason GPU hours reported by Determined may be less than GPU hours reported by the cloud.
Our data is aggregated by Determined metadata (e.g., label, user). This aggregation is performed nightly, so any data visualized on the web UI or downloaded via the endpoint is fresh as of the last night. It will not reflect changes to the metadata of a previously run experiment (e.g., labels) until the next nightly aggregation.

Command-line Interface
Historical cluster usage data are accessible through CLI:
det resources raw <start time> <end time>: get raw allocation information, where the times are full times in the format yyyy-mm-ddThh:mm:ssZ.det resources aggregated <start date> <end date>: get aggregated allocation information, where the dates are in the format yyyy-mm-dd.